Slavic vs Soviet Union Male Unemployment
COMPARE
Slavic
Soviet Union
Male Unemployment
Male Unemployment Comparison
Slavs
Soviet Union
5.1%
MALE UNEMPLOYMENT
94.2/ 100
METRIC RATING
92nd/ 347
METRIC RANK
5.6%
MALE UNEMPLOYMENT
3.2/ 100
METRIC RATING
221st/ 347
METRIC RANK
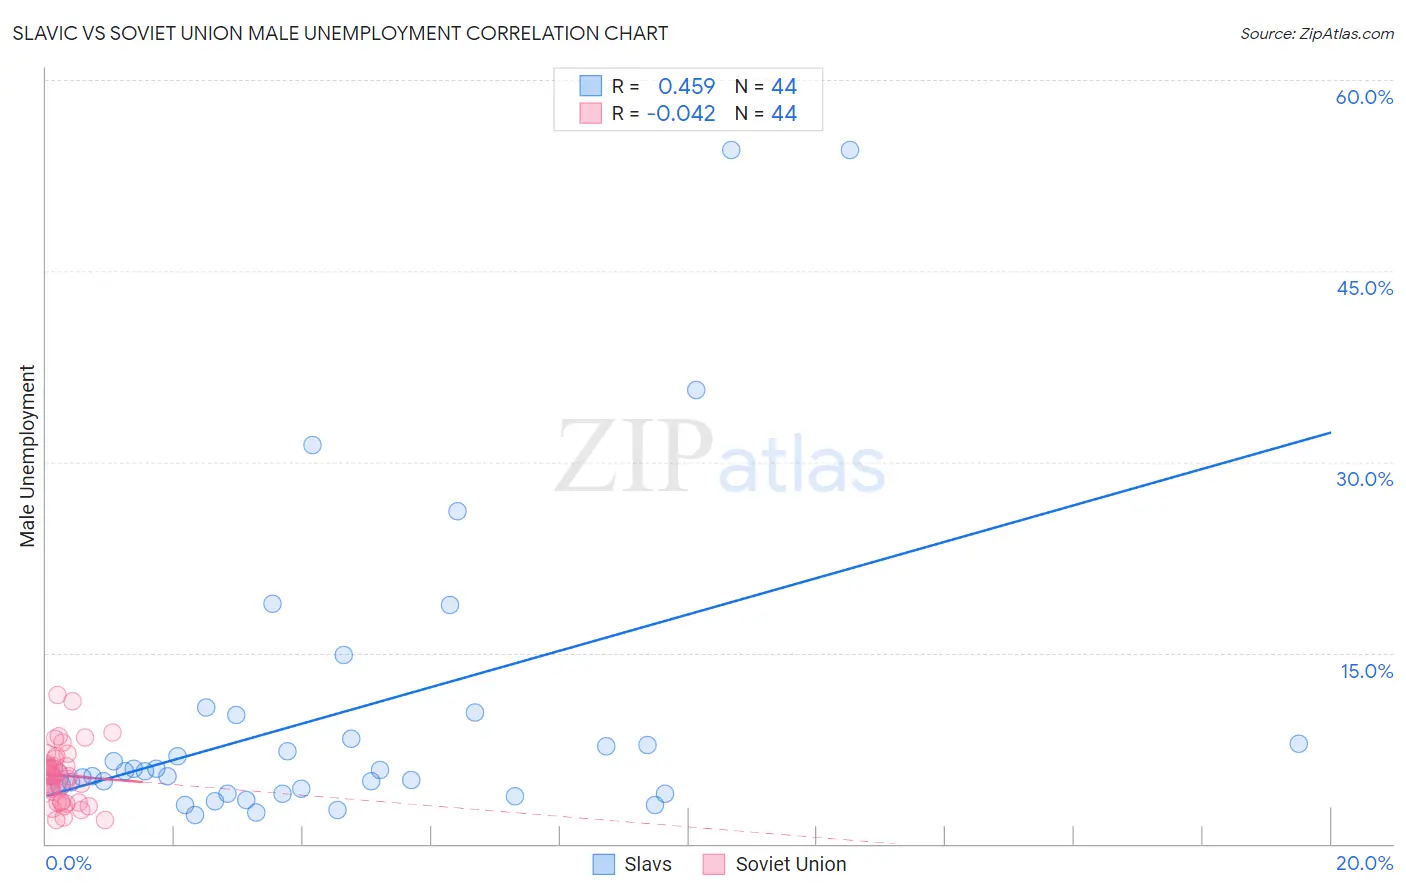
Slavic vs Soviet Union Male Unemployment Correlation Chart
The statistical analysis conducted on geographies consisting of 270,129,729 people shows a moderate positive correlation between the proportion of Slavs and unemployment rate among males in the United States with a correlation coefficient (R) of 0.459 and weighted average of 5.1%. Similarly, the statistical analysis conducted on geographies consisting of 43,494,943 people shows no correlation between the proportion of Soviet Union and unemployment rate among males in the United States with a correlation coefficient (R) of -0.042 and weighted average of 5.6%, a difference of 9.4%.
Male Unemployment Correlation Summary
| Measurement | Slavic | Soviet Union |
| Minimum | 2.2% | 1.9% |
| Maximum | 54.5% | 11.7% |
| Range | 52.3% | 9.8% |
| Mean | 10.3% | 5.4% |
| Median | 5.7% | 5.3% |
| Interquartile 25% (IQ1) | 4.1% | 3.3% |
| Interquartile 75% (IQ3) | 9.1% | 6.4% |
| Interquartile Range (IQR) | 5.0% | 3.1% |
| Standard Deviation (Sample) | 12.2% | 2.3% |
| Standard Deviation (Population) | 12.1% | 2.2% |
Similar Demographics by Male Unemployment
Demographics Similar to Slavs by Male Unemployment
In terms of male unemployment, the demographic groups most similar to Slavs are Immigrants from Serbia (5.1%, a difference of 0.0%), Canadian (5.1%, a difference of 0.050%), Immigrants from Turkey (5.1%, a difference of 0.060%), Italian (5.1%, a difference of 0.12%), and Immigrants from Australia (5.1%, a difference of 0.14%).
| Demographics | Rating | Rank | Male Unemployment |
| Immigrants | North Macedonia | 95.6 /100 | #85 | Exceptional 5.1% |
| Maltese | 95.5 /100 | #86 | Exceptional 5.1% |
| Immigrants | Romania | 95.4 /100 | #87 | Exceptional 5.1% |
| Immigrants | Sri Lanka | 94.9 /100 | #88 | Exceptional 5.1% |
| Immigrants | Australia | 94.7 /100 | #89 | Exceptional 5.1% |
| Okinawans | 94.7 /100 | #90 | Exceptional 5.1% |
| Immigrants | Turkey | 94.4 /100 | #91 | Exceptional 5.1% |
| Slavs | 94.2 /100 | #92 | Exceptional 5.1% |
| Immigrants | Serbia | 94.2 /100 | #93 | Exceptional 5.1% |
| Canadians | 94.1 /100 | #94 | Exceptional 5.1% |
| Italians | 93.8 /100 | #95 | Exceptional 5.1% |
| Asians | 93.7 /100 | #96 | Exceptional 5.1% |
| Immigrants | Spain | 93.4 /100 | #97 | Exceptional 5.1% |
| Immigrants | Kuwait | 93.3 /100 | #98 | Exceptional 5.1% |
| Uruguayans | 93.0 /100 | #99 | Exceptional 5.1% |
Demographics Similar to Soviet Union by Male Unemployment
In terms of male unemployment, the demographic groups most similar to Soviet Union are Portuguese (5.6%, a difference of 0.11%), Immigrants from Western Asia (5.6%, a difference of 0.13%), Immigrants from Micronesia (5.6%, a difference of 0.14%), Immigrants from Albania (5.5%, a difference of 0.18%), and Creek (5.6%, a difference of 0.29%).
| Demographics | Rating | Rank | Male Unemployment |
| Puget Sound Salish | 5.6 /100 | #214 | Tragic 5.5% |
| Samoans | 4.9 /100 | #215 | Tragic 5.5% |
| Immigrants | Immigrants | 4.3 /100 | #216 | Tragic 5.5% |
| Delaware | 4.2 /100 | #217 | Tragic 5.5% |
| Immigrants | Albania | 3.6 /100 | #218 | Tragic 5.5% |
| Immigrants | Western Asia | 3.5 /100 | #219 | Tragic 5.6% |
| Portuguese | 3.5 /100 | #220 | Tragic 5.6% |
| Soviet Union | 3.2 /100 | #221 | Tragic 5.6% |
| Immigrants | Micronesia | 2.9 /100 | #222 | Tragic 5.6% |
| Creek | 2.6 /100 | #223 | Tragic 5.6% |
| Cherokee | 2.4 /100 | #224 | Tragic 5.6% |
| Panamanians | 1.9 /100 | #225 | Tragic 5.6% |
| Immigrants | Cambodia | 1.8 /100 | #226 | Tragic 5.6% |
| Immigrants | Panama | 1.8 /100 | #227 | Tragic 5.6% |
| Seminole | 1.8 /100 | #228 | Tragic 5.6% |