Sioux vs Turkish Unemployment Among Ages 20 to 24 years
COMPARE
Sioux
Turkish
Unemployment Among Ages 20 to 24 years
Unemployment Among Ages 20 to 24 years Comparison
Sioux
Turks
14.2%
UNEMPLOYMENT AMONG AGES 20 TO 24 YEARS
0.0/ 100
METRIC RATING
335th/ 347
METRIC RANK
10.3%
UNEMPLOYMENT AMONG AGES 20 TO 24 YEARS
55.2/ 100
METRIC RATING
170th/ 347
METRIC RANK
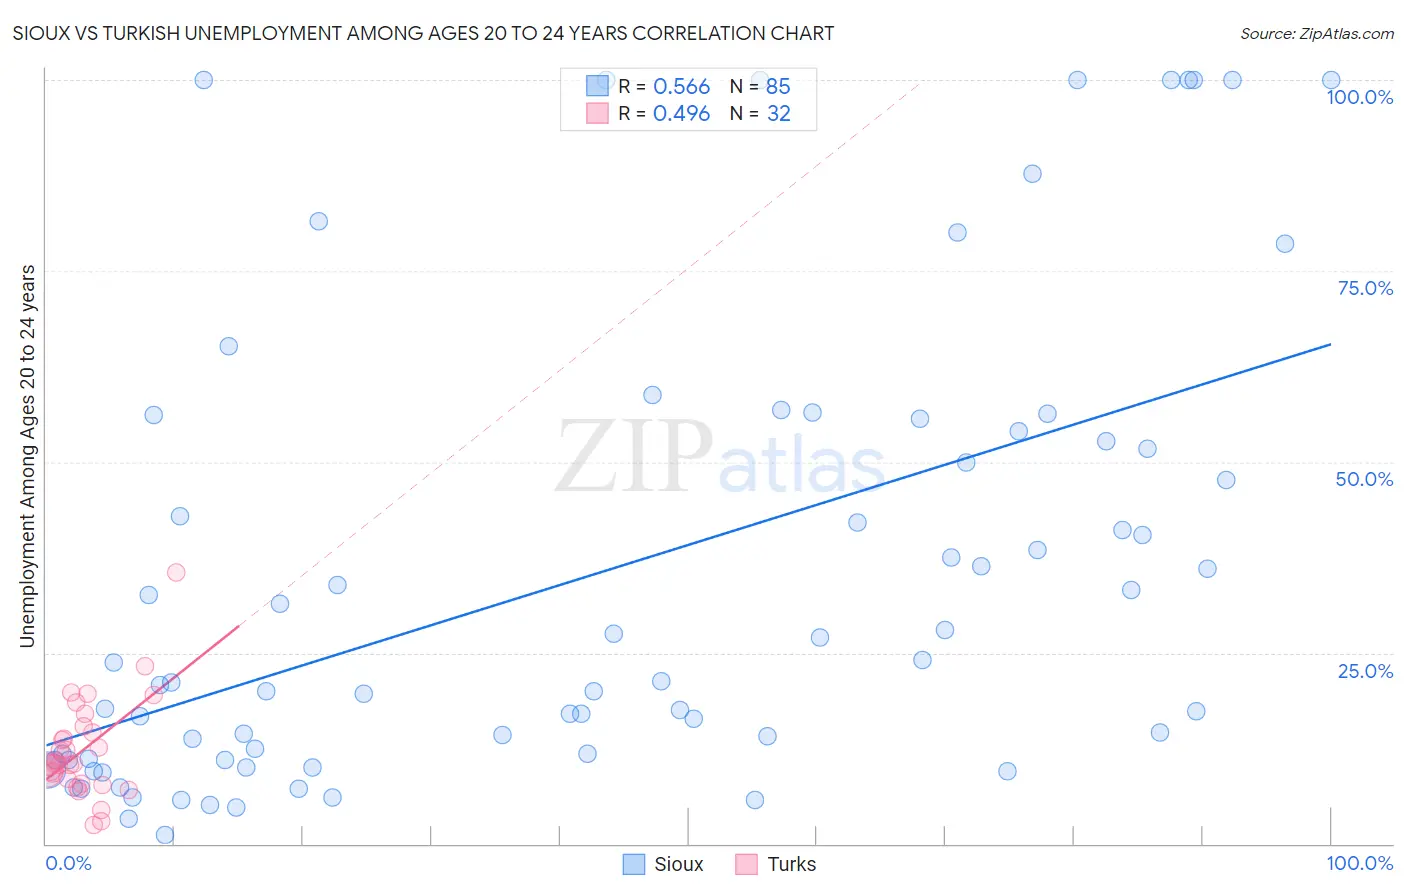
Sioux vs Turkish Unemployment Among Ages 20 to 24 years Correlation Chart
The statistical analysis conducted on geographies consisting of 227,624,418 people shows a substantial positive correlation between the proportion of Sioux and unemployment rate among population between the ages 20 and 24 in the United States with a correlation coefficient (R) of 0.566 and weighted average of 14.2%. Similarly, the statistical analysis conducted on geographies consisting of 266,774,414 people shows a moderate positive correlation between the proportion of Turks and unemployment rate among population between the ages 20 and 24 in the United States with a correlation coefficient (R) of 0.496 and weighted average of 10.3%, a difference of 37.7%.
Unemployment Among Ages 20 to 24 years Correlation Summary
| Measurement | Sioux | Turkish |
| Minimum | 1.1% | 2.5% |
| Maximum | 100.0% | 35.5% |
| Range | 98.9% | 33.0% |
| Mean | 35.1% | 12.3% |
| Median | 21.2% | 10.5% |
| Interquartile 25% (IQ1) | 11.0% | 8.1% |
| Interquartile 75% (IQ3) | 53.3% | 15.0% |
| Interquartile Range (IQR) | 42.3% | 6.8% |
| Standard Deviation (Sample) | 30.2% | 6.5% |
| Standard Deviation (Population) | 30.0% | 6.4% |
Similar Demographics by Unemployment Among Ages 20 to 24 years
Demographics Similar to Sioux by Unemployment Among Ages 20 to 24 years
In terms of unemployment among ages 20 to 24 years, the demographic groups most similar to Sioux are Pima (14.2%, a difference of 0.21%), Guyanese (14.0%, a difference of 1.2%), Paiute (14.3%, a difference of 1.3%), Immigrants from St. Vincent and the Grenadines (14.3%, a difference of 1.3%), and Immigrants from Guyana (13.9%, a difference of 1.7%).
| Demographics | Rating | Rank | Unemployment Among Ages 20 to 24 years |
| British West Indians | 0.0 /100 | #328 | Tragic 13.7% |
| Dominicans | 0.0 /100 | #329 | Tragic 13.8% |
| Arapaho | 0.0 /100 | #330 | Tragic 13.8% |
| Aleuts | 0.0 /100 | #331 | Tragic 13.8% |
| Immigrants | Grenada | 0.0 /100 | #332 | Tragic 13.8% |
| Immigrants | Guyana | 0.0 /100 | #333 | Tragic 13.9% |
| Guyanese | 0.0 /100 | #334 | Tragic 14.0% |
| Sioux | 0.0 /100 | #335 | Tragic 14.2% |
| Pima | 0.0 /100 | #336 | Tragic 14.2% |
| Paiute | 0.0 /100 | #337 | Tragic 14.3% |
| Immigrants | St. Vincent and the Grenadines | 0.0 /100 | #338 | Tragic 14.3% |
| Immigrants | Yemen | 0.0 /100 | #339 | Tragic 14.9% |
| Yuman | 0.0 /100 | #340 | Tragic 15.8% |
| Navajo | 0.0 /100 | #341 | Tragic 16.1% |
| Puerto Ricans | 0.0 /100 | #342 | Tragic 16.7% |
Demographics Similar to Turks by Unemployment Among Ages 20 to 24 years
In terms of unemployment among ages 20 to 24 years, the demographic groups most similar to Turks are Immigrants from Colombia (10.3%, a difference of 0.040%), Iraqi (10.3%, a difference of 0.060%), Immigrants from Fiji (10.3%, a difference of 0.090%), Immigrants from Eastern Asia (10.3%, a difference of 0.090%), and Italian (10.3%, a difference of 0.10%).
| Demographics | Rating | Rank | Unemployment Among Ages 20 to 24 years |
| Estonians | 61.1 /100 | #163 | Good 10.3% |
| Immigrants | Korea | 59.0 /100 | #164 | Average 10.3% |
| Lebanese | 58.3 /100 | #165 | Average 10.3% |
| Italians | 57.7 /100 | #166 | Average 10.3% |
| Immigrants | Fiji | 57.6 /100 | #167 | Average 10.3% |
| Iraqis | 56.7 /100 | #168 | Average 10.3% |
| Immigrants | Colombia | 56.3 /100 | #169 | Average 10.3% |
| Turks | 55.2 /100 | #170 | Average 10.3% |
| Immigrants | Eastern Asia | 52.7 /100 | #171 | Average 10.3% |
| Koreans | 51.9 /100 | #172 | Average 10.3% |
| Immigrants | Sweden | 50.8 /100 | #173 | Average 10.3% |
| Ukrainians | 50.0 /100 | #174 | Average 10.3% |
| Samoans | 45.4 /100 | #175 | Average 10.3% |
| Potawatomi | 42.0 /100 | #176 | Average 10.3% |
| Immigrants | Czechoslovakia | 40.8 /100 | #177 | Average 10.3% |