Sioux vs Native/Alaskan Unemployment Among Ages 25 to 29 years
COMPARE
Sioux
Native/Alaskan
Unemployment Among Ages 25 to 29 years
Unemployment Among Ages 25 to 29 years Comparison
Sioux
Natives/Alaskans
11.7%
UNEMPLOYMENT AMONG AGES 25 TO 29 YEARS
0.0/ 100
METRIC RATING
338th/ 347
METRIC RANK
9.8%
UNEMPLOYMENT AMONG AGES 25 TO 29 YEARS
0.0/ 100
METRIC RATING
330th/ 347
METRIC RANK
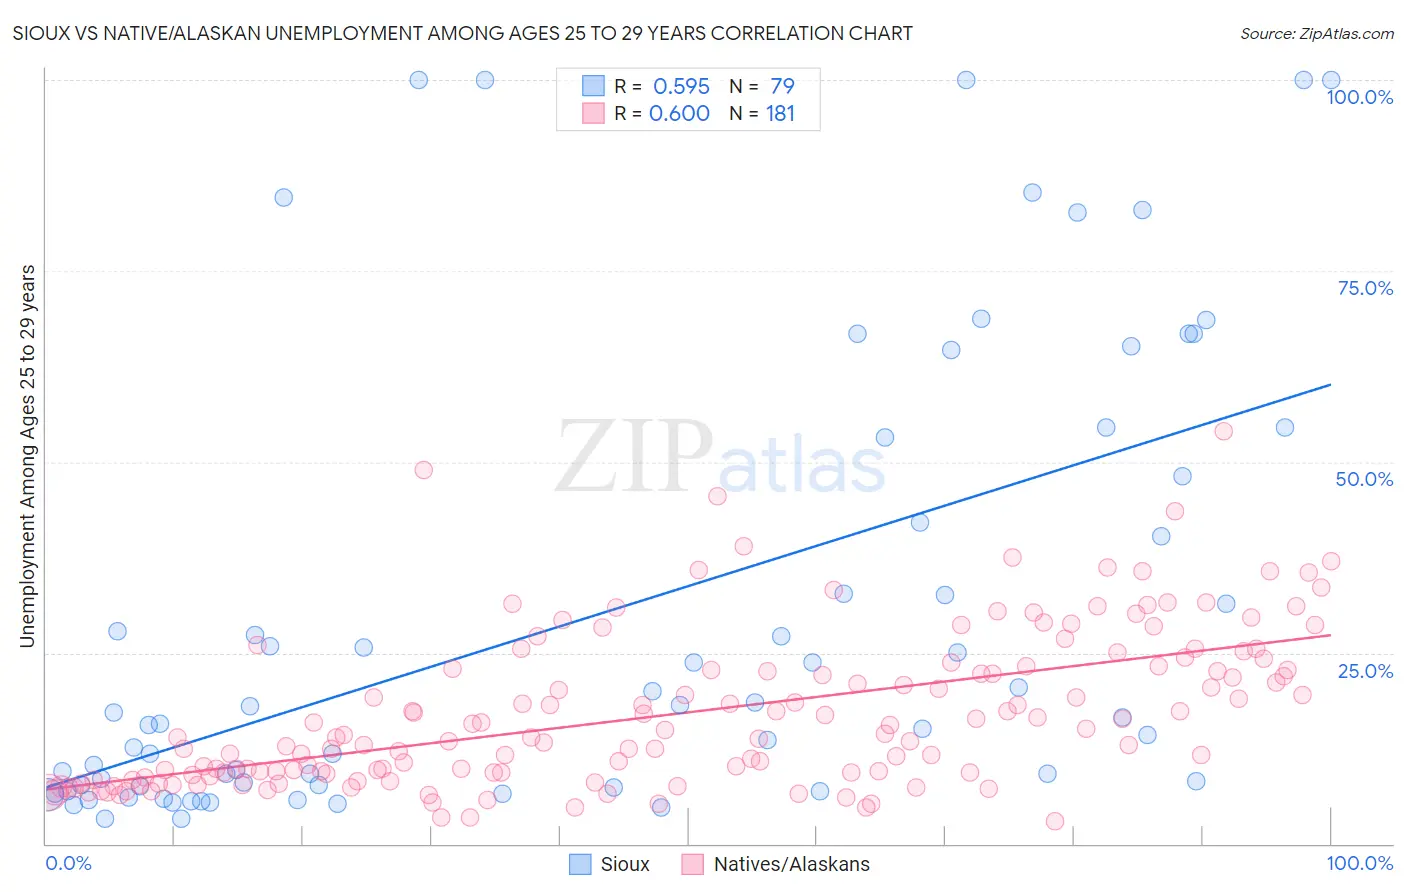
Sioux vs Native/Alaskan Unemployment Among Ages 25 to 29 years Correlation Chart
The statistical analysis conducted on geographies consisting of 224,112,543 people shows a substantial positive correlation between the proportion of Sioux and unemployment rate among population between the ages 25 and 29 in the United States with a correlation coefficient (R) of 0.595 and weighted average of 11.7%. Similarly, the statistical analysis conducted on geographies consisting of 472,592,888 people shows a significant positive correlation between the proportion of Natives/Alaskans and unemployment rate among population between the ages 25 and 29 in the United States with a correlation coefficient (R) of 0.600 and weighted average of 9.8%, a difference of 18.7%.
Unemployment Among Ages 25 to 29 years Correlation Summary
| Measurement | Sioux | Native/Alaskan |
| Minimum | 3.3% | 2.9% |
| Maximum | 100.0% | 54.0% |
| Range | 96.7% | 51.1% |
| Mean | 29.7% | 17.0% |
| Median | 16.6% | 14.0% |
| Interquartile 25% (IQ1) | 7.5% | 9.1% |
| Interquartile 75% (IQ3) | 48.1% | 23.0% |
| Interquartile Range (IQR) | 40.6% | 13.9% |
| Standard Deviation (Sample) | 29.5% | 10.1% |
| Standard Deviation (Population) | 29.3% | 10.1% |
Demographics Similar to Sioux and Natives/Alaskans by Unemployment Among Ages 25 to 29 years
In terms of unemployment among ages 25 to 29 years, the demographic groups most similar to Sioux are Pima (11.8%, a difference of 0.94%), Cheyenne (11.8%, a difference of 1.4%), Tohono O'odham (12.1%, a difference of 3.5%), Menominee (11.3%, a difference of 3.5%), and Lumbee (11.2%, a difference of 3.8%). Similarly, the demographic groups most similar to Natives/Alaskans are Aleut (9.7%, a difference of 1.4%), Apache (9.5%, a difference of 3.6%), Alaska Native (10.2%, a difference of 3.7%), Pueblo (10.4%, a difference of 6.1%), and Colville (9.2%, a difference of 6.3%).
| Demographics | Rating | Rank | Unemployment Among Ages 25 to 29 years |
| Houma | 0.0 /100 | #324 | Tragic 8.7% |
| Yakama | 0.0 /100 | #325 | Tragic 8.8% |
| Shoshone | 0.0 /100 | #326 | Tragic 9.2% |
| Colville | 0.0 /100 | #327 | Tragic 9.2% |
| Apache | 0.0 /100 | #328 | Tragic 9.5% |
| Aleuts | 0.0 /100 | #329 | Tragic 9.7% |
| Natives/Alaskans | 0.0 /100 | #330 | Tragic 9.8% |
| Alaska Natives | 0.0 /100 | #331 | Tragic 10.2% |
| Pueblo | 0.0 /100 | #332 | Tragic 10.4% |
| Alaskan Athabascans | 0.0 /100 | #333 | Tragic 10.8% |
| Yuman | 0.0 /100 | #334 | Tragic 11.0% |
| Puerto Ricans | 0.0 /100 | #335 | Tragic 11.1% |
| Lumbee | 0.0 /100 | #336 | Tragic 11.2% |
| Menominee | 0.0 /100 | #337 | Tragic 11.3% |
| Sioux | 0.0 /100 | #338 | Tragic 11.7% |
| Pima | 0.0 /100 | #339 | Tragic 11.8% |
| Cheyenne | 0.0 /100 | #340 | Tragic 11.8% |
| Tohono O'odham | 0.0 /100 | #341 | Tragic 12.1% |
| Navajo | 0.0 /100 | #342 | Tragic 12.2% |
| Inupiat | 0.0 /100 | #343 | Tragic 13.4% |
| Hopi | 0.0 /100 | #344 | Tragic 13.5% |