Sierra Leonean vs Maltese Male Unemployment
COMPARE
Sierra Leonean
Maltese
Male Unemployment
Male Unemployment Comparison
Sierra Leoneans
Maltese
6.2%
MALE UNEMPLOYMENT
0.0/ 100
METRIC RATING
281st/ 347
METRIC RANK
5.1%
MALE UNEMPLOYMENT
95.5/ 100
METRIC RATING
86th/ 347
METRIC RANK
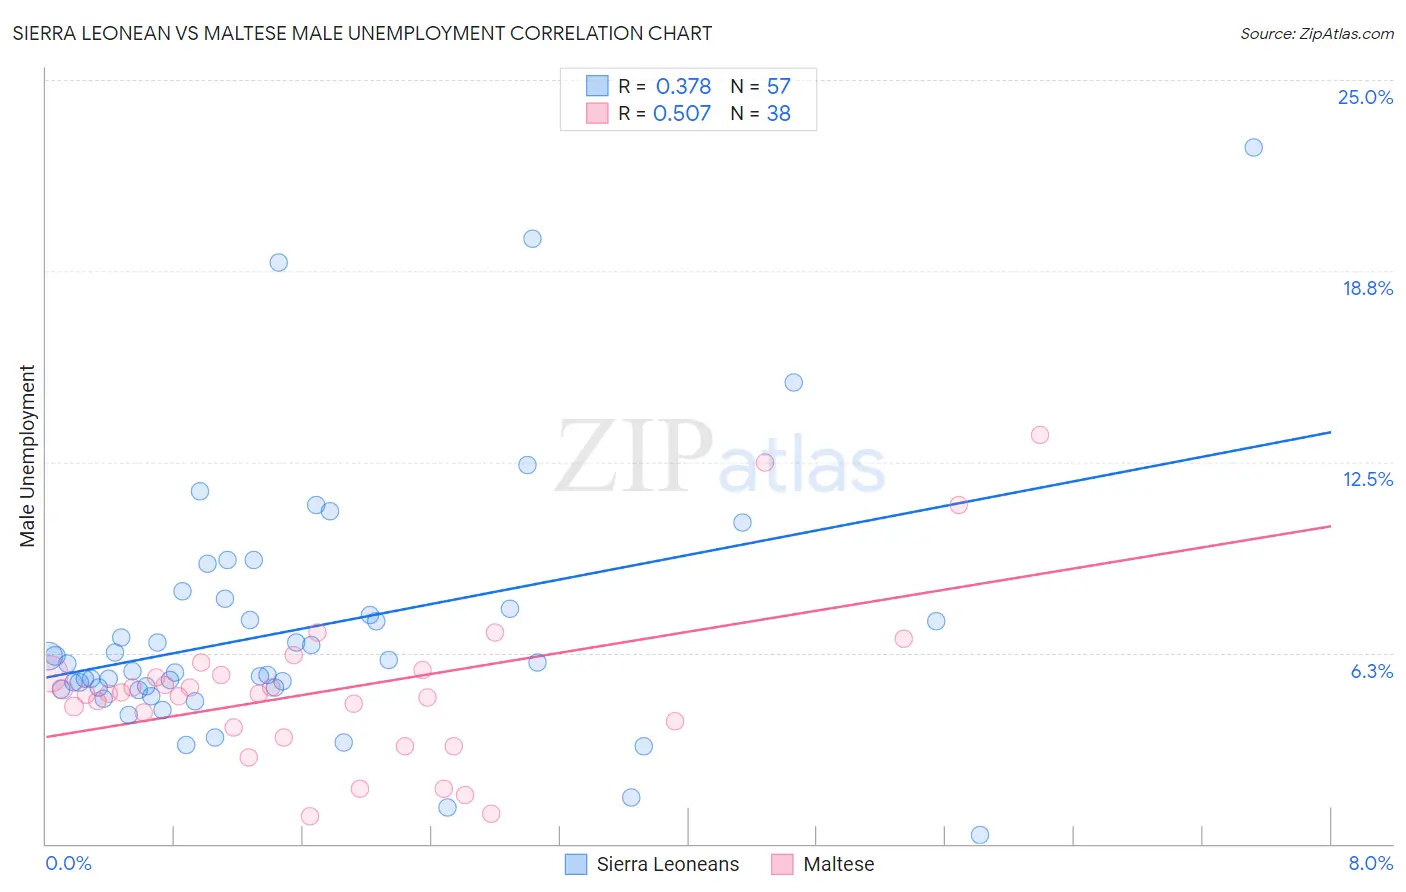
Sierra Leonean vs Maltese Male Unemployment Correlation Chart
The statistical analysis conducted on geographies consisting of 83,306,317 people shows a mild positive correlation between the proportion of Sierra Leoneans and unemployment rate among males in the United States with a correlation coefficient (R) of 0.378 and weighted average of 6.2%. Similarly, the statistical analysis conducted on geographies consisting of 126,309,580 people shows a substantial positive correlation between the proportion of Maltese and unemployment rate among males in the United States with a correlation coefficient (R) of 0.507 and weighted average of 5.1%, a difference of 21.7%.
Male Unemployment Correlation Summary
| Measurement | Sierra Leonean | Maltese |
| Minimum | 0.30% | 0.90% |
| Maximum | 22.8% | 13.4% |
| Range | 22.5% | 12.5% |
| Mean | 7.0% | 5.1% |
| Median | 5.9% | 4.9% |
| Interquartile 25% (IQ1) | 5.1% | 3.8% |
| Interquartile 75% (IQ3) | 7.9% | 5.5% |
| Interquartile Range (IQR) | 2.8% | 1.8% |
| Standard Deviation (Sample) | 4.2% | 2.6% |
| Standard Deviation (Population) | 4.2% | 2.6% |
Similar Demographics by Male Unemployment
Demographics Similar to Sierra Leoneans by Male Unemployment
In terms of male unemployment, the demographic groups most similar to Sierra Leoneans are Immigrants from Ghana (6.2%, a difference of 0.070%), Ecuadorian (6.2%, a difference of 0.43%), Immigrants from Western Africa (6.2%, a difference of 0.46%), Ghanaian (6.1%, a difference of 1.1%), and Spanish American Indian (6.2%, a difference of 1.1%).
| Demographics | Rating | Rank | Male Unemployment |
| Immigrants | Sierra Leone | 0.0 /100 | #274 | Tragic 6.0% |
| Menominee | 0.0 /100 | #275 | Tragic 6.0% |
| Tlingit-Haida | 0.0 /100 | #276 | Tragic 6.0% |
| Immigrants | Liberia | 0.0 /100 | #277 | Tragic 6.1% |
| Immigrants | Fiji | 0.0 /100 | #278 | Tragic 6.1% |
| Ghanaians | 0.0 /100 | #279 | Tragic 6.1% |
| Immigrants | Ghana | 0.0 /100 | #280 | Tragic 6.2% |
| Sierra Leoneans | 0.0 /100 | #281 | Tragic 6.2% |
| Ecuadorians | 0.0 /100 | #282 | Tragic 6.2% |
| Immigrants | Western Africa | 0.0 /100 | #283 | Tragic 6.2% |
| Spanish American Indians | 0.0 /100 | #284 | Tragic 6.2% |
| Immigrants | Ecuador | 0.0 /100 | #285 | Tragic 6.2% |
| Africans | 0.0 /100 | #286 | Tragic 6.3% |
| Central American Indians | 0.0 /100 | #287 | Tragic 6.3% |
| Immigrants | Senegal | 0.0 /100 | #288 | Tragic 6.3% |
Demographics Similar to Maltese by Male Unemployment
In terms of male unemployment, the demographic groups most similar to Maltese are Immigrants from Romania (5.1%, a difference of 0.020%), Immigrants from North Macedonia (5.1%, a difference of 0.040%), Serbian (5.1%, a difference of 0.090%), Immigrants from Sri Lanka (5.1%, a difference of 0.20%), and Immigrants from Eritrea (5.0%, a difference of 0.21%).
| Demographics | Rating | Rank | Male Unemployment |
| South Africans | 96.4 /100 | #79 | Exceptional 5.0% |
| Argentineans | 96.2 /100 | #80 | Exceptional 5.0% |
| French | 96.2 /100 | #81 | Exceptional 5.0% |
| Chileans | 96.2 /100 | #82 | Exceptional 5.0% |
| Immigrants | Eritrea | 96.0 /100 | #83 | Exceptional 5.0% |
| Serbians | 95.7 /100 | #84 | Exceptional 5.1% |
| Immigrants | North Macedonia | 95.6 /100 | #85 | Exceptional 5.1% |
| Maltese | 95.5 /100 | #86 | Exceptional 5.1% |
| Immigrants | Romania | 95.4 /100 | #87 | Exceptional 5.1% |
| Immigrants | Sri Lanka | 94.9 /100 | #88 | Exceptional 5.1% |
| Immigrants | Australia | 94.7 /100 | #89 | Exceptional 5.1% |
| Okinawans | 94.7 /100 | #90 | Exceptional 5.1% |
| Immigrants | Turkey | 94.4 /100 | #91 | Exceptional 5.1% |
| Slavs | 94.2 /100 | #92 | Exceptional 5.1% |
| Immigrants | Serbia | 94.2 /100 | #93 | Exceptional 5.1% |