Sierra Leonean vs Lebanese Unemployment Among Ages 65 to 74 years
COMPARE
Sierra Leonean
Lebanese
Unemployment Among Ages 65 to 74 years
Unemployment Among Ages 65 to 74 years Comparison
Sierra Leoneans
Lebanese
5.6%
UNEMPLOYMENT AMONG AGES 65 TO 74 YEARS
0.2/ 100
METRIC RATING
259th/ 347
METRIC RANK
4.9%
UNEMPLOYMENT AMONG AGES 65 TO 74 YEARS
100.0/ 100
METRIC RATING
22nd/ 347
METRIC RANK
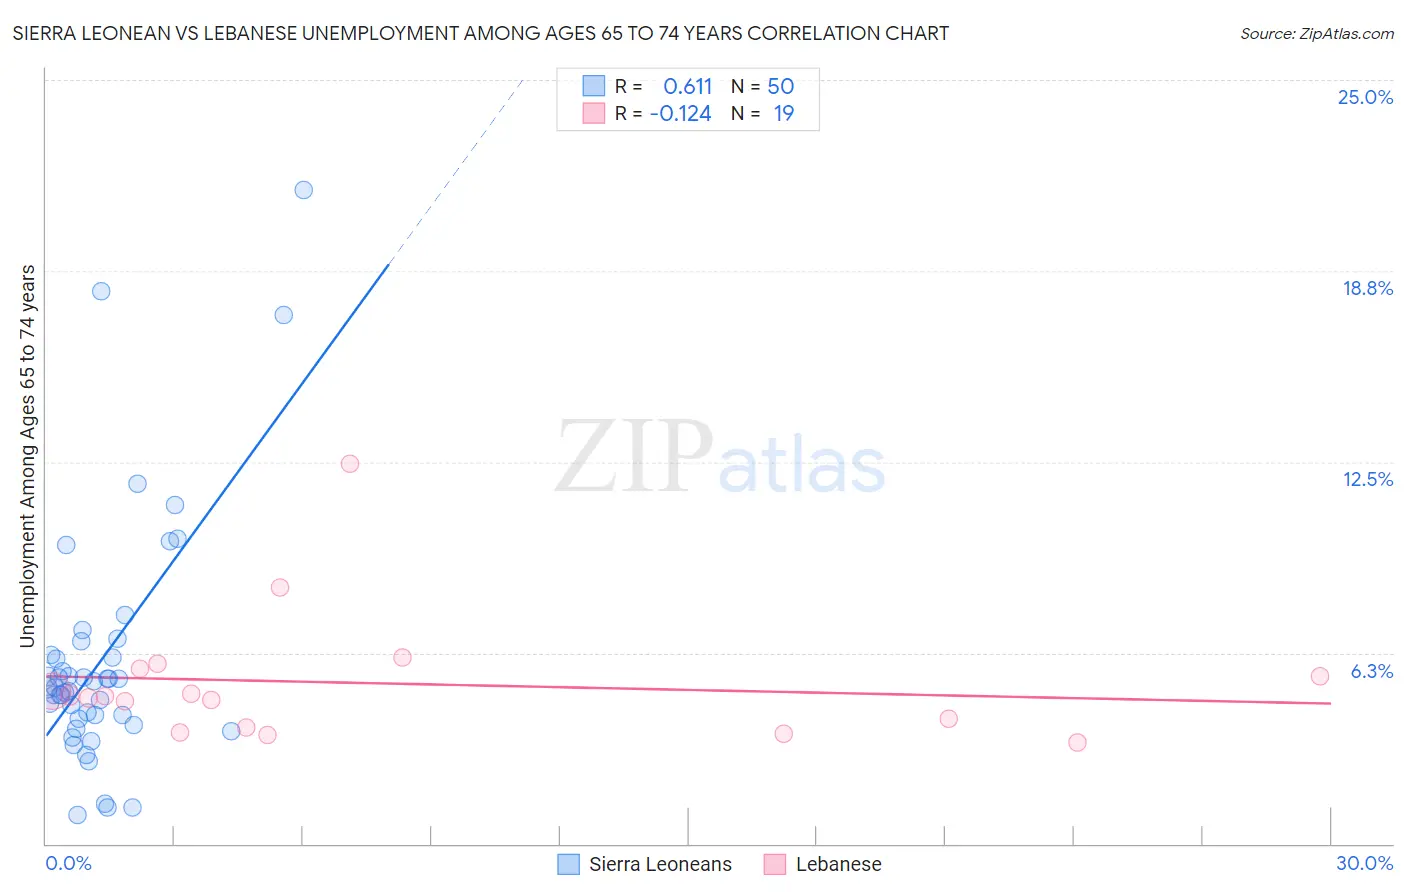
Sierra Leonean vs Lebanese Unemployment Among Ages 65 to 74 years Correlation Chart
The statistical analysis conducted on geographies consisting of 80,892,281 people shows a significant positive correlation between the proportion of Sierra Leoneans and unemployment rate among population between the ages 65 and 74 in the United States with a correlation coefficient (R) of 0.611 and weighted average of 5.6%. Similarly, the statistical analysis conducted on geographies consisting of 352,325,673 people shows a poor negative correlation between the proportion of Lebanese and unemployment rate among population between the ages 65 and 74 in the United States with a correlation coefficient (R) of -0.124 and weighted average of 4.9%, a difference of 15.2%.
Unemployment Among Ages 65 to 74 years Correlation Summary
| Measurement | Sierra Leonean | Lebanese |
| Minimum | 0.93% | 3.3% |
| Maximum | 21.4% | 12.4% |
| Range | 20.5% | 9.1% |
| Mean | 6.0% | 5.3% |
| Median | 5.1% | 4.8% |
| Interquartile 25% (IQ1) | 4.1% | 3.8% |
| Interquartile 75% (IQ3) | 6.2% | 5.7% |
| Interquartile Range (IQR) | 2.1% | 1.9% |
| Standard Deviation (Sample) | 4.0% | 2.1% |
| Standard Deviation (Population) | 4.0% | 2.0% |
Similar Demographics by Unemployment Among Ages 65 to 74 years
Demographics Similar to Sierra Leoneans by Unemployment Among Ages 65 to 74 years
In terms of unemployment among ages 65 to 74 years, the demographic groups most similar to Sierra Leoneans are Immigrants from Barbados (5.6%, a difference of 0.020%), Immigrants from Western Africa (5.6%, a difference of 0.070%), South American (5.6%, a difference of 0.070%), Immigrants from St. Vincent and the Grenadines (5.6%, a difference of 0.12%), and Immigrants from Jamaica (5.6%, a difference of 0.13%).
| Demographics | Rating | Rank | Unemployment Among Ages 65 to 74 years |
| Colombians | 0.5 /100 | #252 | Tragic 5.6% |
| Immigrants | Brazil | 0.5 /100 | #253 | Tragic 5.6% |
| Immigrants | Costa Rica | 0.5 /100 | #254 | Tragic 5.6% |
| Immigrants | Haiti | 0.4 /100 | #255 | Tragic 5.6% |
| Native Hawaiians | 0.4 /100 | #256 | Tragic 5.6% |
| Immigrants | Southern Europe | 0.3 /100 | #257 | Tragic 5.6% |
| Immigrants | Western Africa | 0.3 /100 | #258 | Tragic 5.6% |
| Sierra Leoneans | 0.2 /100 | #259 | Tragic 5.6% |
| Immigrants | Barbados | 0.2 /100 | #260 | Tragic 5.6% |
| South Americans | 0.2 /100 | #261 | Tragic 5.6% |
| Immigrants | St. Vincent and the Grenadines | 0.2 /100 | #262 | Tragic 5.6% |
| Immigrants | Jamaica | 0.2 /100 | #263 | Tragic 5.6% |
| Pueblo | 0.2 /100 | #264 | Tragic 5.6% |
| Jamaicans | 0.2 /100 | #265 | Tragic 5.6% |
| French Canadians | 0.2 /100 | #266 | Tragic 5.6% |
Demographics Similar to Lebanese by Unemployment Among Ages 65 to 74 years
In terms of unemployment among ages 65 to 74 years, the demographic groups most similar to Lebanese are Immigrants from Nepal (4.9%, a difference of 0.38%), Iraqi (4.9%, a difference of 0.59%), Immigrants from Eritrea (4.9%, a difference of 0.75%), Immigrants from Zaire (4.8%, a difference of 1.1%), and Macedonian (5.0%, a difference of 1.2%).
| Demographics | Rating | Rank | Unemployment Among Ages 65 to 74 years |
| Immigrants | North Macedonia | 100.0 /100 | #15 | Exceptional 4.8% |
| Immigrants | Burma/Myanmar | 100.0 /100 | #16 | Exceptional 4.8% |
| Kenyans | 100.0 /100 | #17 | Exceptional 4.8% |
| Creek | 100.0 /100 | #18 | Exceptional 4.8% |
| Menominee | 100.0 /100 | #19 | Exceptional 4.8% |
| Immigrants | Zaire | 100.0 /100 | #20 | Exceptional 4.8% |
| Immigrants | Eritrea | 100.0 /100 | #21 | Exceptional 4.9% |
| Lebanese | 100.0 /100 | #22 | Exceptional 4.9% |
| Immigrants | Nepal | 100.0 /100 | #23 | Exceptional 4.9% |
| Iraqis | 100.0 /100 | #24 | Exceptional 4.9% |
| Macedonians | 100.0 /100 | #25 | Exceptional 5.0% |
| Czechs | 100.0 /100 | #26 | Exceptional 5.0% |
| Norwegians | 100.0 /100 | #27 | Exceptional 5.0% |
| Bulgarians | 100.0 /100 | #28 | Exceptional 5.0% |
| Ethiopians | 100.0 /100 | #29 | Exceptional 5.0% |