Senegalese vs African Unemployment
COMPARE
Senegalese
African
Unemployment
Unemployment Comparison
Senegalese
Africans
6.2%
UNEMPLOYMENT
0.0/ 100
METRIC RATING
290th/ 347
METRIC RANK
6.1%
UNEMPLOYMENT
0.0/ 100
METRIC RATING
281st/ 347
METRIC RANK
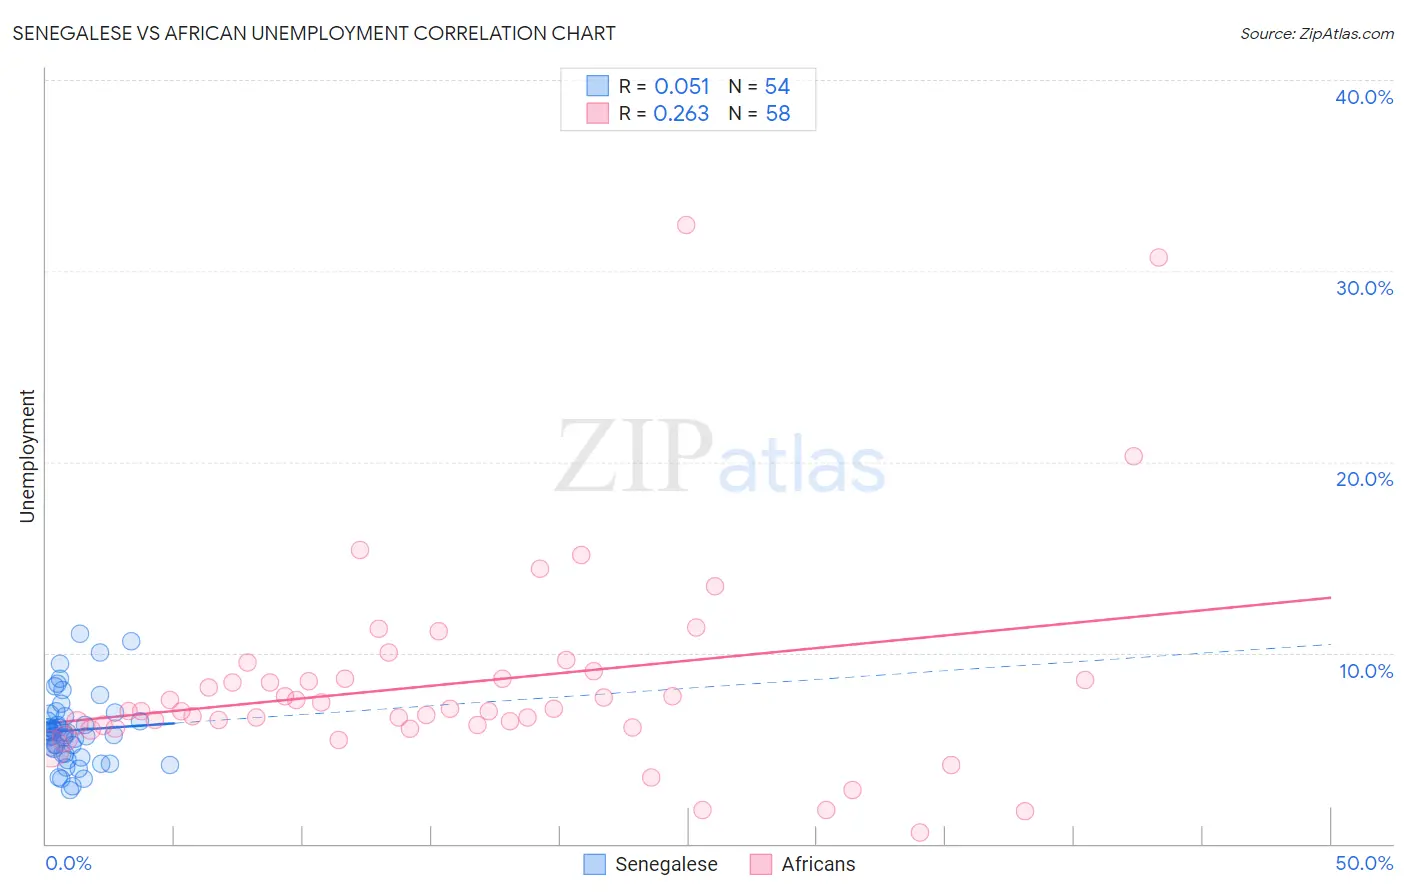
Senegalese vs African Unemployment Correlation Chart
The statistical analysis conducted on geographies consisting of 78,136,746 people shows a slight positive correlation between the proportion of Senegalese and unemployment in the United States with a correlation coefficient (R) of 0.051 and weighted average of 6.2%. Similarly, the statistical analysis conducted on geographies consisting of 469,312,899 people shows a weak positive correlation between the proportion of Africans and unemployment in the United States with a correlation coefficient (R) of 0.263 and weighted average of 6.1%, a difference of 2.5%.
Unemployment Correlation Summary
| Measurement | Senegalese | African |
| Minimum | 2.8% | 0.60% |
| Maximum | 11.0% | 32.4% |
| Range | 8.2% | 31.8% |
| Mean | 5.9% | 8.4% |
| Median | 5.8% | 7.0% |
| Interquartile 25% (IQ1) | 4.7% | 6.2% |
| Interquartile 75% (IQ3) | 6.7% | 8.6% |
| Interquartile Range (IQR) | 2.0% | 2.4% |
| Standard Deviation (Sample) | 1.8% | 5.6% |
| Standard Deviation (Population) | 1.8% | 5.5% |
Demographics Similar to Senegalese and Africans by Unemployment
In terms of unemployment, the demographic groups most similar to Senegalese are Chippewa (6.2%, a difference of 0.090%), Ecuadorian (6.2%, a difference of 0.44%), Nepalese (6.2%, a difference of 0.47%), Haitian (6.2%, a difference of 0.53%), and Central American Indian (6.2%, a difference of 0.54%). Similarly, the demographic groups most similar to Africans are Immigrants from the Azores (6.1%, a difference of 0.060%), Immigrants from Ghana (6.1%, a difference of 0.15%), Aleut (6.1%, a difference of 0.28%), Immigrants from Mexico (6.0%, a difference of 0.58%), and Immigrants from Western Africa (6.0%, a difference of 0.58%).
| Demographics | Rating | Rank | Unemployment |
| Immigrants | Latin America | 0.0 /100 | #275 | Tragic 5.9% |
| Immigrants | Central America | 0.0 /100 | #276 | Tragic 6.0% |
| Armenians | 0.0 /100 | #277 | Tragic 6.0% |
| Ghanaians | 0.0 /100 | #278 | Tragic 6.0% |
| Immigrants | Mexico | 0.0 /100 | #279 | Tragic 6.0% |
| Immigrants | Western Africa | 0.0 /100 | #280 | Tragic 6.0% |
| Africans | 0.0 /100 | #281 | Tragic 6.1% |
| Immigrants | Azores | 0.0 /100 | #282 | Tragic 6.1% |
| Immigrants | Ghana | 0.0 /100 | #283 | Tragic 6.1% |
| Aleuts | 0.0 /100 | #284 | Tragic 6.1% |
| Immigrants | Senegal | 0.0 /100 | #285 | Tragic 6.1% |
| Immigrants | Caribbean | 0.0 /100 | #286 | Tragic 6.2% |
| Nepalese | 0.0 /100 | #287 | Tragic 6.2% |
| Ecuadorians | 0.0 /100 | #288 | Tragic 6.2% |
| Chippewa | 0.0 /100 | #289 | Tragic 6.2% |
| Senegalese | 0.0 /100 | #290 | Tragic 6.2% |
| Haitians | 0.0 /100 | #291 | Tragic 6.2% |
| Central American Indians | 0.0 /100 | #292 | Tragic 6.2% |
| Immigrants | Ecuador | 0.0 /100 | #293 | Tragic 6.2% |
| Spanish American Indians | 0.0 /100 | #294 | Tragic 6.2% |
| U.S. Virgin Islanders | 0.0 /100 | #295 | Tragic 6.3% |