Seminole vs Lithuanian Unemployment Among Women with Children Under 6 years
COMPARE
Seminole
Lithuanian
Unemployment Among Women with Children Under 6 years
Unemployment Among Women with Children Under 6 years Comparison
Seminole
Lithuanians
8.7%
UNEMPLOYMENT AMONG WOMEN WITH CHILDREN UNDER 6 YEARS
0.0/ 100
METRIC RATING
286th/ 347
METRIC RANK
7.8%
UNEMPLOYMENT AMONG WOMEN WITH CHILDREN UNDER 6 YEARS
30.0/ 100
METRIC RATING
198th/ 347
METRIC RANK
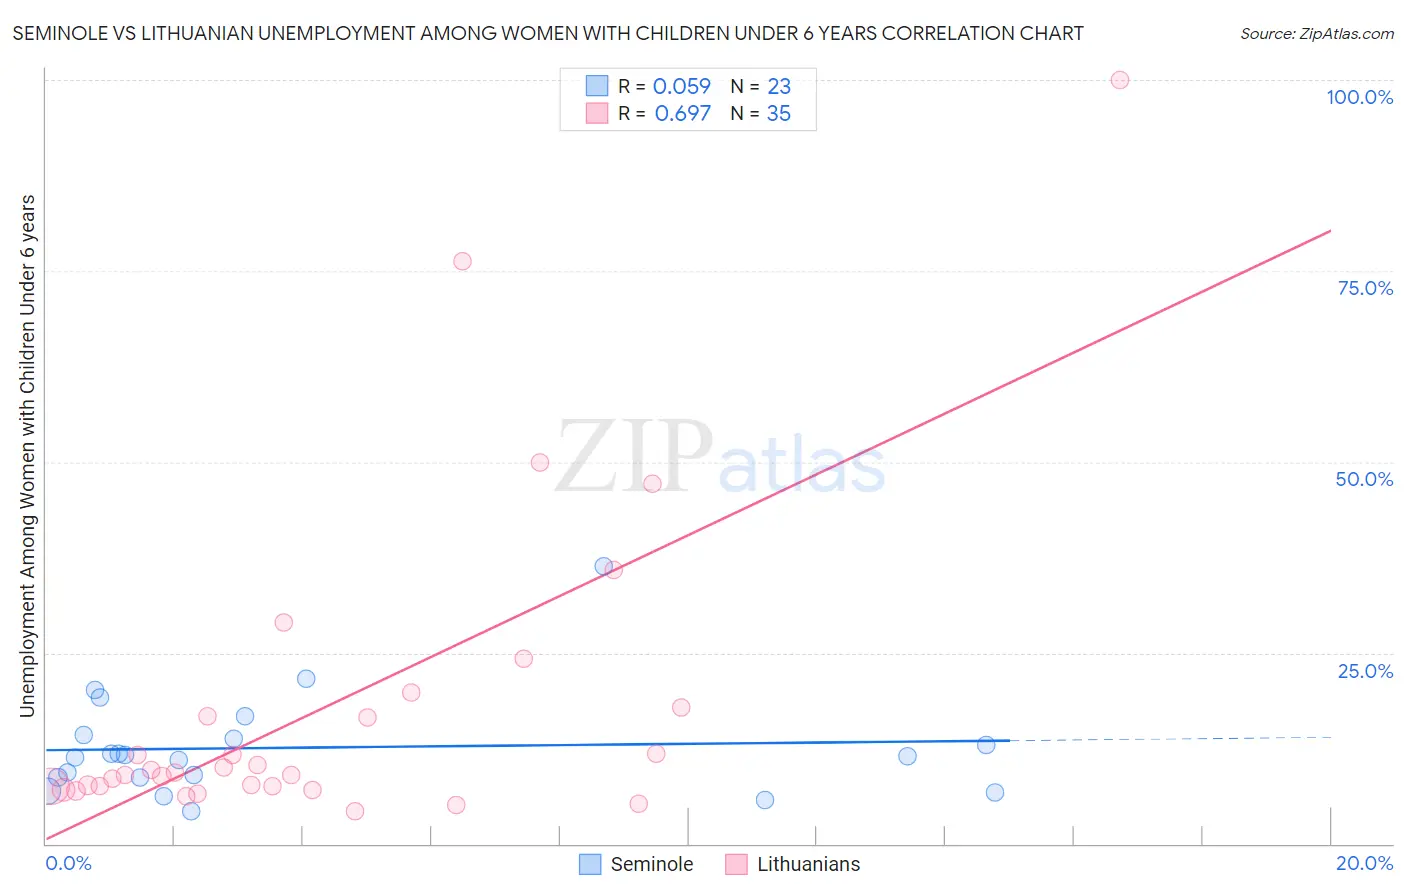
Seminole vs Lithuanian Unemployment Among Women with Children Under 6 years Correlation Chart
The statistical analysis conducted on geographies consisting of 105,546,612 people shows a slight positive correlation between the proportion of Seminole and unemployment rate among women with children under the age of 6 in the United States with a correlation coefficient (R) of 0.059 and weighted average of 8.7%. Similarly, the statistical analysis conducted on geographies consisting of 306,238,361 people shows a significant positive correlation between the proportion of Lithuanians and unemployment rate among women with children under the age of 6 in the United States with a correlation coefficient (R) of 0.697 and weighted average of 7.8%, a difference of 12.2%.
Unemployment Among Women with Children Under 6 years Correlation Summary
| Measurement | Seminole | Lithuanian |
| Minimum | 4.3% | 4.2% |
| Maximum | 36.4% | 100.0% |
| Range | 32.1% | 95.8% |
| Mean | 12.6% | 18.0% |
| Median | 11.4% | 9.3% |
| Interquartile 25% (IQ1) | 8.6% | 7.5% |
| Interquartile 75% (IQ3) | 14.2% | 17.9% |
| Interquartile Range (IQR) | 5.6% | 10.4% |
| Standard Deviation (Sample) | 6.9% | 20.9% |
| Standard Deviation (Population) | 6.8% | 20.6% |
Similar Demographics by Unemployment Among Women with Children Under 6 years
Demographics Similar to Seminole by Unemployment Among Women with Children Under 6 years
In terms of unemployment among women with children under 6 years, the demographic groups most similar to Seminole are U.S. Virgin Islander (8.7%, a difference of 0.0%), Menominee (8.7%, a difference of 0.15%), Blackfeet (8.7%, a difference of 0.20%), Bahamian (8.7%, a difference of 0.35%), and Spanish American Indian (8.7%, a difference of 0.36%).
| Demographics | Rating | Rank | Unemployment Among Women with Children Under 6 years |
| Immigrants | Guatemala | 0.0 /100 | #279 | Tragic 8.6% |
| Immigrants | Belize | 0.0 /100 | #280 | Tragic 8.6% |
| Guatemalans | 0.0 /100 | #281 | Tragic 8.7% |
| Bermudans | 0.0 /100 | #282 | Tragic 8.7% |
| Spanish American Indians | 0.0 /100 | #283 | Tragic 8.7% |
| Blackfeet | 0.0 /100 | #284 | Tragic 8.7% |
| U.S. Virgin Islanders | 0.0 /100 | #285 | Tragic 8.7% |
| Seminole | 0.0 /100 | #286 | Tragic 8.7% |
| Menominee | 0.0 /100 | #287 | Tragic 8.7% |
| Bahamians | 0.0 /100 | #288 | Tragic 8.7% |
| Iroquois | 0.0 /100 | #289 | Tragic 8.7% |
| Vietnamese | 0.0 /100 | #290 | Tragic 8.8% |
| Jamaicans | 0.0 /100 | #291 | Tragic 8.8% |
| Cheyenne | 0.0 /100 | #292 | Tragic 8.8% |
| Immigrants | Bangladesh | 0.0 /100 | #293 | Tragic 8.8% |
Demographics Similar to Lithuanians by Unemployment Among Women with Children Under 6 years
In terms of unemployment among women with children under 6 years, the demographic groups most similar to Lithuanians are Italian (7.7%, a difference of 0.030%), Immigrants from St. Vincent and the Grenadines (7.7%, a difference of 0.080%), Malaysian (7.7%, a difference of 0.090%), Syrian (7.7%, a difference of 0.15%), and Slavic (7.7%, a difference of 0.18%).
| Demographics | Rating | Rank | Unemployment Among Women with Children Under 6 years |
| Immigrants | Austria | 32.4 /100 | #191 | Fair 7.7% |
| Immigrants | Africa | 32.4 /100 | #192 | Fair 7.7% |
| Slavs | 32.4 /100 | #193 | Fair 7.7% |
| Syrians | 31.9 /100 | #194 | Fair 7.7% |
| Malaysians | 31.1 /100 | #195 | Fair 7.7% |
| Immigrants | St. Vincent and the Grenadines | 31.1 /100 | #196 | Fair 7.7% |
| Italians | 30.4 /100 | #197 | Fair 7.7% |
| Lithuanians | 30.0 /100 | #198 | Fair 7.8% |
| Immigrants | Poland | 27.3 /100 | #199 | Fair 7.8% |
| Guamanians/Chamorros | 25.5 /100 | #200 | Fair 7.8% |
| Basques | 24.7 /100 | #201 | Fair 7.8% |
| Sudanese | 23.5 /100 | #202 | Fair 7.8% |
| Spaniards | 23.3 /100 | #203 | Fair 7.8% |
| Lebanese | 22.2 /100 | #204 | Fair 7.8% |
| Immigrants | Immigrants | 21.4 /100 | #205 | Fair 7.8% |