Seminole vs German Russian Unemployment Among Youth under 25 years
COMPARE
Seminole
German Russian
Unemployment Among Youth under 25 years
Unemployment Among Youth under 25 years Comparison
Seminole
German Russians
11.7%
UNEMPLOYMENT AMONG YOUTH UNDER 25 YEARS
27.9/ 100
METRIC RATING
193rd/ 347
METRIC RANK
11.2%
UNEMPLOYMENT AMONG YOUTH UNDER 25 YEARS
97.0/ 100
METRIC RATING
76th/ 347
METRIC RANK
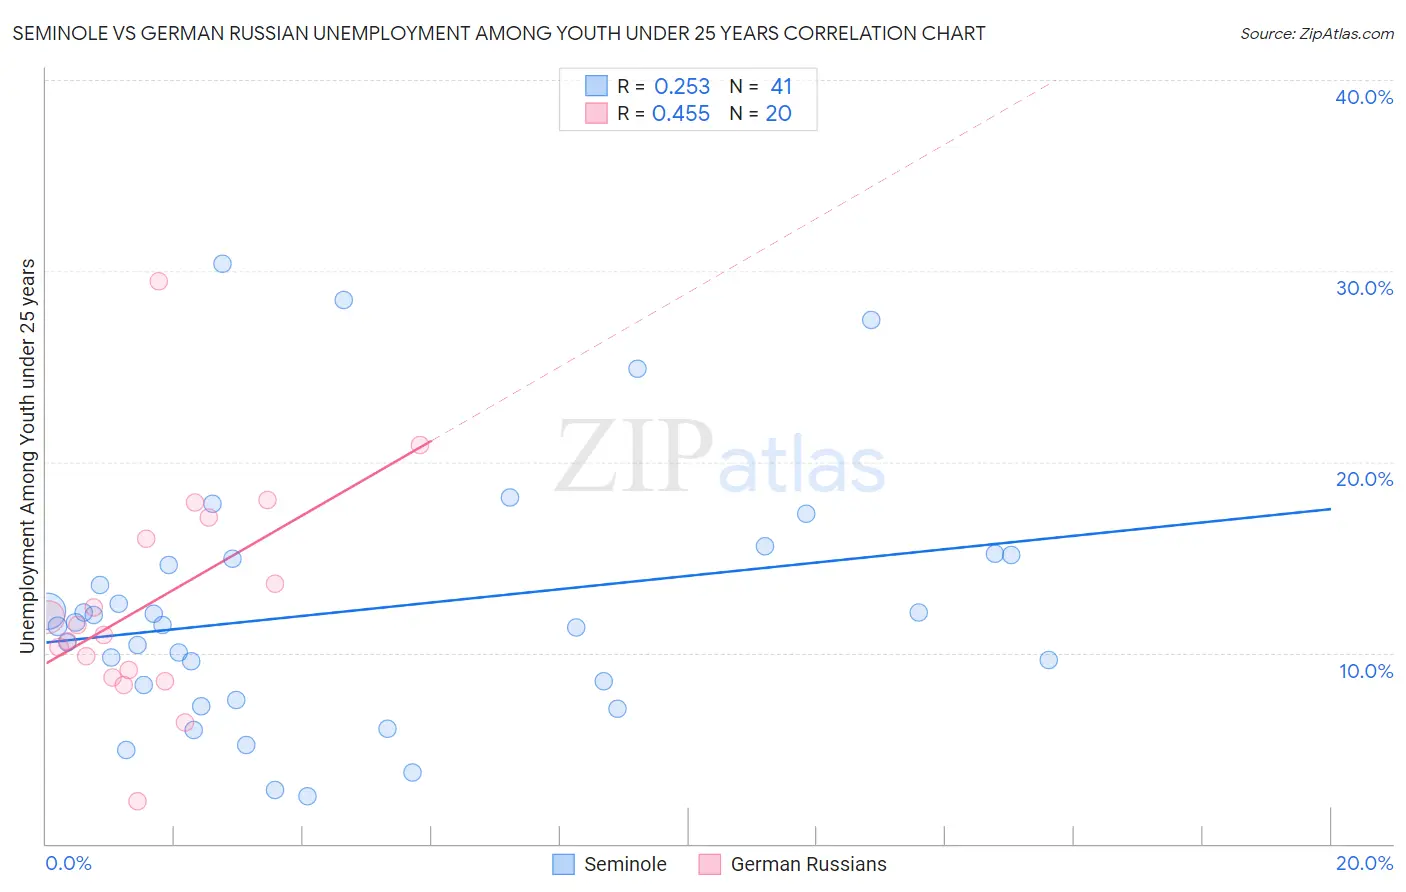
Seminole vs German Russian Unemployment Among Youth under 25 years Correlation Chart
The statistical analysis conducted on geographies consisting of 117,813,457 people shows a weak positive correlation between the proportion of Seminole and unemployment rate among youth under the age of 25 in the United States with a correlation coefficient (R) of 0.253 and weighted average of 11.7%. Similarly, the statistical analysis conducted on geographies consisting of 95,940,958 people shows a moderate positive correlation between the proportion of German Russians and unemployment rate among youth under the age of 25 in the United States with a correlation coefficient (R) of 0.455 and weighted average of 11.2%, a difference of 4.7%.
Unemployment Among Youth under 25 years Correlation Summary
| Measurement | Seminole | German Russian |
| Minimum | 2.5% | 2.2% |
| Maximum | 30.4% | 29.4% |
| Range | 27.9% | 27.2% |
| Mean | 12.2% | 12.7% |
| Median | 11.4% | 11.2% |
| Interquartile 25% (IQ1) | 7.9% | 8.9% |
| Interquartile 75% (IQ3) | 15.0% | 16.5% |
| Interquartile Range (IQR) | 7.1% | 7.6% |
| Standard Deviation (Sample) | 6.5% | 6.0% |
| Standard Deviation (Population) | 6.4% | 5.8% |
Similar Demographics by Unemployment Among Youth under 25 years
Demographics Similar to Seminole by Unemployment Among Youth under 25 years
In terms of unemployment among youth under 25 years, the demographic groups most similar to Seminole are Immigrants from Sri Lanka (11.7%, a difference of 0.010%), Cypriot (11.7%, a difference of 0.030%), Immigrants from Russia (11.7%, a difference of 0.030%), Paraguayan (11.7%, a difference of 0.040%), and Egyptian (11.7%, a difference of 0.050%).
| Demographics | Rating | Rank | Unemployment Among Youth under 25 years |
| Maltese | 33.9 /100 | #186 | Fair 11.7% |
| Immigrants | Egypt | 31.9 /100 | #187 | Fair 11.7% |
| Immigrants | Poland | 31.4 /100 | #188 | Fair 11.7% |
| Japanese | 30.8 /100 | #189 | Fair 11.7% |
| Portuguese | 30.3 /100 | #190 | Fair 11.7% |
| Cypriots | 28.5 /100 | #191 | Fair 11.7% |
| Immigrants | Russia | 28.5 /100 | #192 | Fair 11.7% |
| Seminole | 27.9 /100 | #193 | Fair 11.7% |
| Immigrants | Sri Lanka | 27.8 /100 | #194 | Fair 11.7% |
| Paraguayans | 27.2 /100 | #195 | Fair 11.7% |
| Egyptians | 26.9 /100 | #196 | Fair 11.7% |
| Koreans | 23.9 /100 | #197 | Fair 11.7% |
| Cherokee | 21.2 /100 | #198 | Fair 11.8% |
| Immigrants | Colombia | 20.9 /100 | #199 | Fair 11.8% |
| Arabs | 18.0 /100 | #200 | Poor 11.8% |
Demographics Similar to German Russians by Unemployment Among Youth under 25 years
In terms of unemployment among youth under 25 years, the demographic groups most similar to German Russians are French (11.2%, a difference of 0.020%), New Zealander (11.2%, a difference of 0.050%), White/Caucasian (11.2%, a difference of 0.050%), Creek (11.2%, a difference of 0.060%), and Immigrants from Australia (11.2%, a difference of 0.11%).
| Demographics | Rating | Rank | Unemployment Among Youth under 25 years |
| Immigrants | Moldova | 97.5 /100 | #69 | Exceptional 11.2% |
| Slavs | 97.5 /100 | #70 | Exceptional 11.2% |
| Bhutanese | 97.4 /100 | #71 | Exceptional 11.2% |
| Immigrants | Australia | 97.3 /100 | #72 | Exceptional 11.2% |
| Creek | 97.2 /100 | #73 | Exceptional 11.2% |
| New Zealanders | 97.2 /100 | #74 | Exceptional 11.2% |
| French | 97.1 /100 | #75 | Exceptional 11.2% |
| German Russians | 97.0 /100 | #76 | Exceptional 11.2% |
| Whites/Caucasians | 96.9 /100 | #77 | Exceptional 11.2% |
| Immigrants | Nicaragua | 96.7 /100 | #78 | Exceptional 11.2% |
| Immigrants | Canada | 96.7 /100 | #79 | Exceptional 11.2% |
| Immigrants | Bulgaria | 96.4 /100 | #80 | Exceptional 11.2% |
| Icelanders | 96.3 /100 | #81 | Exceptional 11.2% |
| Northern Europeans | 96.2 /100 | #82 | Exceptional 11.2% |
| Bolivians | 96.1 /100 | #83 | Exceptional 11.2% |