Scotch-Irish vs Swiss Unemployment Among Ages 25 to 29 years
COMPARE
Scotch-Irish
Swiss
Unemployment Among Ages 25 to 29 years
Unemployment Among Ages 25 to 29 years Comparison
Scotch-Irish
Swiss
6.8%
UNEMPLOYMENT AMONG AGES 25 TO 29 YEARS
20.0/ 100
METRIC RATING
204th/ 347
METRIC RANK
6.4%
UNEMPLOYMENT AMONG AGES 25 TO 29 YEARS
88.6/ 100
METRIC RATING
107th/ 347
METRIC RANK
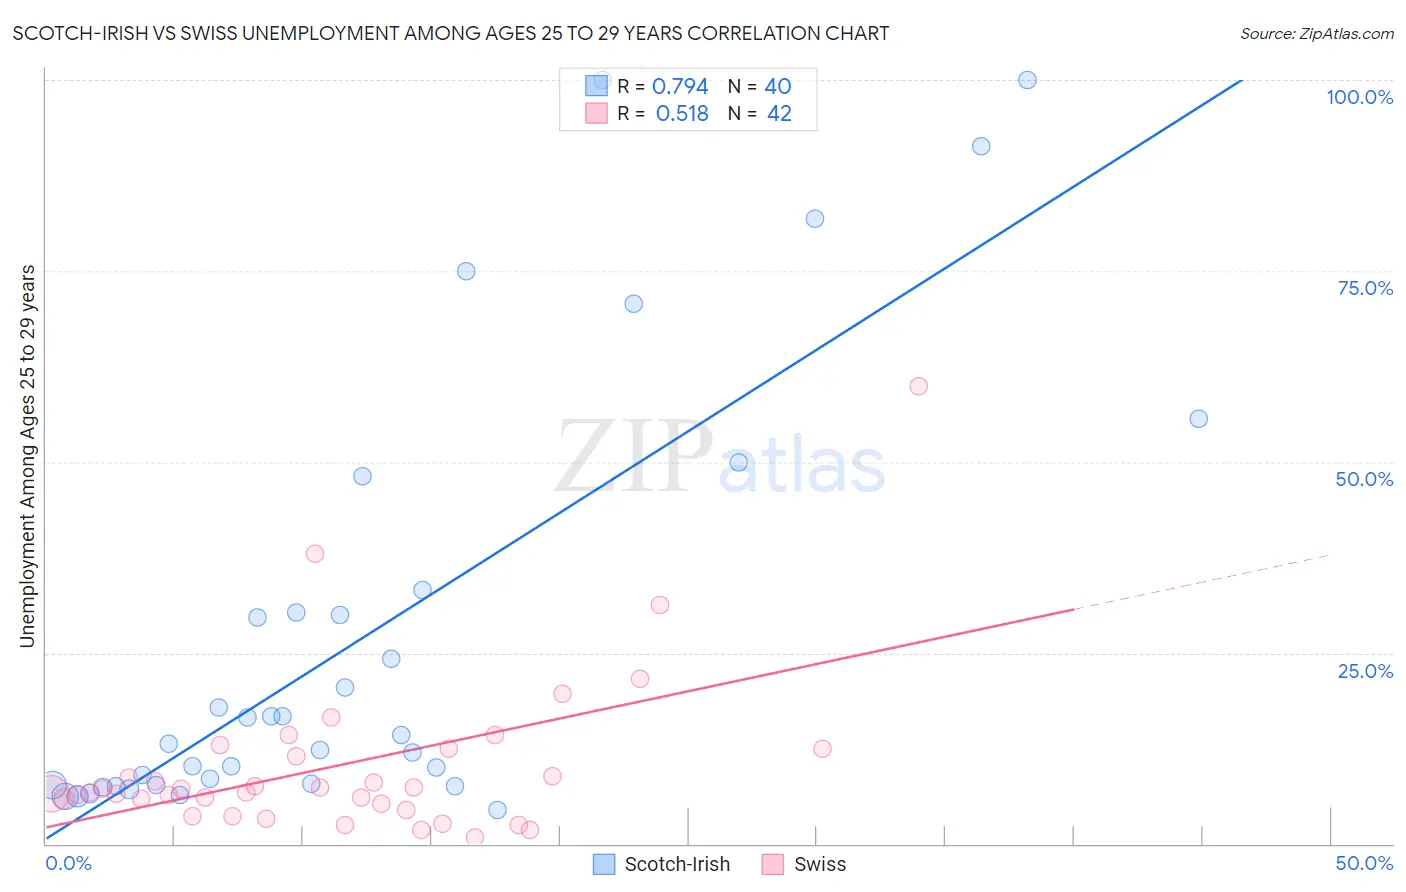
Scotch-Irish vs Swiss Unemployment Among Ages 25 to 29 years Correlation Chart
The statistical analysis conducted on geographies consisting of 489,887,362 people shows a strong positive correlation between the proportion of Scotch-Irish and unemployment rate among population between the ages 25 and 29 in the United States with a correlation coefficient (R) of 0.794 and weighted average of 6.8%. Similarly, the statistical analysis conducted on geographies consisting of 427,383,004 people shows a substantial positive correlation between the proportion of Swiss and unemployment rate among population between the ages 25 and 29 in the United States with a correlation coefficient (R) of 0.518 and weighted average of 6.4%, a difference of 5.5%.
Unemployment Among Ages 25 to 29 years Correlation Summary
| Measurement | Scotch-Irish | Swiss |
| Minimum | 4.5% | 0.90% |
| Maximum | 100.0% | 59.9% |
| Range | 95.5% | 59.0% |
| Mean | 27.2% | 10.2% |
| Median | 13.7% | 7.0% |
| Interquartile 25% (IQ1) | 7.7% | 5.2% |
| Interquartile 75% (IQ3) | 31.8% | 12.5% |
| Interquartile Range (IQR) | 24.1% | 7.3% |
| Standard Deviation (Sample) | 28.4% | 10.8% |
| Standard Deviation (Population) | 28.1% | 10.7% |
Similar Demographics by Unemployment Among Ages 25 to 29 years
Demographics Similar to Scotch-Irish by Unemployment Among Ages 25 to 29 years
In terms of unemployment among ages 25 to 29 years, the demographic groups most similar to Scotch-Irish are Immigrants from England (6.8%, a difference of 0.010%), Ugandan (6.8%, a difference of 0.020%), Immigrants from Denmark (6.8%, a difference of 0.090%), Immigrants from Germany (6.8%, a difference of 0.11%), and Immigrants from Norway (6.8%, a difference of 0.12%).
| Demographics | Rating | Rank | Unemployment Among Ages 25 to 29 years |
| Italians | 26.5 /100 | #197 | Fair 6.8% |
| Immigrants | Southern Europe | 24.6 /100 | #198 | Fair 6.8% |
| Guamanians/Chamorros | 24.3 /100 | #199 | Fair 6.8% |
| South American Indians | 23.3 /100 | #200 | Fair 6.8% |
| Basques | 22.5 /100 | #201 | Fair 6.8% |
| Immigrants | Argentina | 21.6 /100 | #202 | Fair 6.8% |
| Immigrants | Norway | 21.2 /100 | #203 | Fair 6.8% |
| Scotch-Irish | 20.0 /100 | #204 | Poor 6.8% |
| Immigrants | England | 19.8 /100 | #205 | Poor 6.8% |
| Ugandans | 19.8 /100 | #206 | Poor 6.8% |
| Immigrants | Denmark | 19.0 /100 | #207 | Poor 6.8% |
| Immigrants | Germany | 18.8 /100 | #208 | Poor 6.8% |
| Hawaiians | 17.1 /100 | #209 | Poor 6.8% |
| Canadians | 16.9 /100 | #210 | Poor 6.8% |
| Immigrants | Philippines | 16.7 /100 | #211 | Poor 6.8% |
Demographics Similar to Swiss by Unemployment Among Ages 25 to 29 years
In terms of unemployment among ages 25 to 29 years, the demographic groups most similar to Swiss are Croatian (6.4%, a difference of 0.060%), Immigrants from Albania (6.4%, a difference of 0.10%), European (6.4%, a difference of 0.11%), Immigrants from Hungary (6.4%, a difference of 0.14%), and Immigrants from Colombia (6.4%, a difference of 0.15%).
| Demographics | Rating | Rank | Unemployment Among Ages 25 to 29 years |
| Uruguayans | 91.2 /100 | #100 | Exceptional 6.4% |
| Immigrants | Ireland | 91.1 /100 | #101 | Exceptional 6.4% |
| British | 90.5 /100 | #102 | Exceptional 6.4% |
| Immigrants | Congo | 90.4 /100 | #103 | Exceptional 6.4% |
| Cypriots | 90.1 /100 | #104 | Exceptional 6.4% |
| Immigrants | Kazakhstan | 89.8 /100 | #105 | Excellent 6.4% |
| Immigrants | Hungary | 89.4 /100 | #106 | Excellent 6.4% |
| Swiss | 88.6 /100 | #107 | Excellent 6.4% |
| Croatians | 88.2 /100 | #108 | Excellent 6.4% |
| Immigrants | Albania | 87.9 /100 | #109 | Excellent 6.4% |
| Europeans | 87.8 /100 | #110 | Excellent 6.4% |
| Immigrants | Colombia | 87.6 /100 | #111 | Excellent 6.4% |
| Immigrants | Nicaragua | 87.5 /100 | #112 | Excellent 6.4% |
| Immigrants | Egypt | 87.1 /100 | #113 | Excellent 6.5% |
| Germans | 86.3 /100 | #114 | Excellent 6.5% |