Scandinavian vs Scottish Unemployment Among Ages 55 to 59 years

COMPARE

Scandinavian
Race
Ancestry
AfghanAfricanAlaska NativeAlaskan AthabascanAlbanianAleutAlsatianAmericanApacheArabArapahoArgentineanArmenianAssyrian/Chaldean/SyriacAustralianAustrianBahamianBangladeshiBarbadianBasqueBelgianBelizeanBermudanBhutaneseBlackfeetBolivianBrazilianBritishBritish West IndianBulgarianBurmeseCajunCambodianCanadianCape VerdeanCarpatho RusynCelticCentral AmericanCentral American IndianCherokeeCheyenneChickasawChileanChineseChippewaChoctawColombianColvilleComancheCosta RicanCreeCreekCroatianCrowCubanCypriotCzechCzechoslovakianDanishDelawareDominicanDutchDutch West IndianEastern EuropeanEcuadorianEgyptianEnglishEstonianEthiopianEuropeanFijianFilipinoFinnishFrenchFrench American IndianFrench CanadianGermanGerman RussianGhanaianGreekGuamanian/ChamorroGuatemalanGuyaneseHaitianHmongHonduranHopiHoumaHungarianIcelanderIndian (Asian)IndonesianInupiatIranianIraqiIrishIroquoisIsraeliItalianJamaicanJapaneseJordanianKenyanKiowaKoreanLaotianLatvianLebaneseLiberianLithuanianLumbeeLuxembourgerMacedonianMalaysianMalteseMarshalleseMenomineeMexicanMexican American IndianMongolianMoroccanNative HawaiianNavajoNepaleseNew ZealanderNicaraguanNigerianNorthern EuropeanNorwegianOkinawanOsageOttawaPaiutePakistaniPalestinianPanamanianParaguayanPennsylvania GermanPeruvianPimaPolishPortuguesePotawatomiPuebloPuerto RicanPuget Sound SalishRomanianRussianSalvadoranSamoanScandinavianScotch-IrishSeminoleSenegaleseSerbianShoshoneSierra LeoneanSiouxSlavicSlovakSloveneSomaliSouth AfricanSouth AmericanSouth American IndianSoviet UnionSpaniardSpanishSpanish AmericanSpanish American IndianSri LankanSubsaharan AfricanSudaneseSwedishSwissSyrianTaiwaneseThaiTlingit-HaidaTohono O'OdhamTonganTrinidadian and TobagonianTsimshianTurkishU.S. Virgin IslanderUgandanUkrainianUruguayanUteVenezuelanVietnameseWelshWest IndianYakamaYaquiYugoslavianYumanYup'ikZimbabwean
Immigration
NonimmigrantsImmigrantsAfghanistanAfricaAlbaniaArgentinaArmeniaAsiaAustraliaAustriaBahamasBangladeshBarbadosBelarusBelgiumBelizeBoliviaBosnia and HerzegovinaBrazilBulgariaBurma/MyanmarCabo VerdeCambodiaCameroonCanadaCaribbeanCentral AmericaChileChinaColombiaCongoCosta RicaCroatiaCubaCzechoslovakiaDenmarkDominicaDominican RepublicEastern AfricaEastern AsiaEastern EuropeEcuadorEgyptEl SalvadorEnglandEritreaEthiopiaEuropeFijiFranceGermanyGhanaGreeceGrenadaGuatemalaGuyanaHaitiHondurasHong KongHungaryIndiaIndonesiaIranIraqIrelandIsraelItalyJamaicaJapanJordanKazakhstanKenyaKoreaKuwaitLaosLatin AmericaLatviaLebanonLiberiaLithuaniaMalaysiaMexicoMicronesiaMiddle AfricaMoldovaMoroccoNepalNetherlandsNicaraguaNigeriaNorth AmericaNorth MacedoniaNorthern AfricaNorthern EuropeNorwayOceaniaPakistanPanamaPeruPhilippinesPolandPortugalRomaniaRussiaSaudi ArabiaScotlandSenegalSerbiaSierra LeoneSingaporeSomaliaSouth AfricaSouth AmericaSouth Central AsiaSouth Eastern AsiaSouthern EuropeSpainSri LankaSt. Vincent and the GrenadinesSudanSwedenSwitzerlandSyriaTaiwanThailandTrinidad and TobagoTurkeyUgandaUkraineUruguayUzbekistanVenezuelaVietnamWest IndiesWestern AfricaWestern AsiaWestern EuropeYemenZaireZimbabweAzores
Scottish
Race
Ancestry
AfghanAfricanAlaska NativeAlaskan AthabascanAlbanianAleutAlsatianAmericanApacheArabArapahoArgentineanArmenianAssyrian/Chaldean/SyriacAustralianAustrianBahamianBangladeshiBarbadianBasqueBelgianBelizeanBermudanBhutaneseBlackfeetBolivianBrazilianBritishBritish West IndianBulgarianBurmeseCajunCambodianCanadianCape VerdeanCarpatho RusynCelticCentral AmericanCentral American IndianCherokeeCheyenneChickasawChileanChineseChippewaChoctawColombianColvilleComancheCosta RicanCreeCreekCroatianCrowCubanCypriotCzechCzechoslovakianDanishDelawareDominicanDutchDutch West IndianEastern EuropeanEcuadorianEgyptianEnglishEstonianEthiopianEuropeanFijianFilipinoFinnishFrenchFrench American IndianFrench CanadianGermanGerman RussianGhanaianGreekGuamanian/ChamorroGuatemalanGuyaneseHaitianHmongHonduranHopiHoumaHungarianIcelanderIndian (Asian)IndonesianInupiatIranianIraqiIrishIroquoisIsraeliItalianJamaicanJapaneseJordanianKenyanKiowaKoreanLaotianLatvianLebaneseLiberianLithuanianLumbeeLuxembourgerMacedonianMalaysianMalteseMarshalleseMenomineeMexicanMexican American IndianMongolianMoroccanNative HawaiianNavajoNepaleseNew ZealanderNicaraguanNigerianNorthern EuropeanNorwegianOkinawanOsageOttawaPaiutePakistaniPalestinianPanamanianParaguayanPennsylvania GermanPeruvianPimaPolishPortuguesePotawatomiPuebloPuerto RicanPuget Sound SalishRomanianRussianSalvadoranSamoanScotch-IrishScottishSeminoleSenegaleseSerbianShoshoneSierra LeoneanSiouxSlavicSlovakSloveneSomaliSouth AfricanSouth AmericanSouth American IndianSoviet UnionSpaniardSpanishSpanish AmericanSpanish American IndianSri LankanSubsaharan AfricanSudaneseSwedishSwissSyrianTaiwaneseThaiTlingit-HaidaTohono O'OdhamTonganTrinidadian and TobagonianTsimshianTurkishU.S. Virgin IslanderUgandanUkrainianUruguayanUteVenezuelanVietnameseWelshWest IndianYakamaYaquiYugoslavianYumanYup'ikZimbabwean
Immigration
NonimmigrantsImmigrantsAfghanistanAfricaAlbaniaArgentinaArmeniaAsiaAustraliaAustriaBahamasBangladeshBarbadosBelarusBelgiumBelizeBoliviaBosnia and HerzegovinaBrazilBulgariaBurma/MyanmarCabo VerdeCambodiaCameroonCanadaCaribbeanCentral AmericaChileChinaColombiaCongoCosta RicaCroatiaCubaCzechoslovakiaDenmarkDominicaDominican RepublicEastern AfricaEastern AsiaEastern EuropeEcuadorEgyptEl SalvadorEnglandEritreaEthiopiaEuropeFijiFranceGermanyGhanaGreeceGrenadaGuatemalaGuyanaHaitiHondurasHong KongHungaryIndiaIndonesiaIranIraqIrelandIsraelItalyJamaicaJapanJordanKazakhstanKenyaKoreaKuwaitLaosLatin AmericaLatviaLebanonLiberiaLithuaniaMalaysiaMexicoMicronesiaMiddle AfricaMoldovaMoroccoNepalNetherlandsNicaraguaNigeriaNorth AmericaNorth MacedoniaNorthern AfricaNorthern EuropeNorwayOceaniaPakistanPanamaPeruPhilippinesPolandPortugalRomaniaRussiaSaudi ArabiaScotlandSenegalSerbiaSierra LeoneSingaporeSomaliaSouth AfricaSouth AmericaSouth Central AsiaSouth Eastern AsiaSouthern EuropeSpainSri LankaSt. Vincent and the GrenadinesSudanSwedenSwitzerlandSyriaTaiwanThailandTrinidad and TobagoTurkeyUgandaUkraineUruguayUzbekistanVenezuelaVietnamWest IndiesWestern AfricaWestern AsiaWestern EuropeYemenZaireZimbabweAzores
Unemployment Among Ages 55 to 59 years
Income
Poverty
Unemployment
Labor Participation
Family Structure
Vehicle Availability
Education Level
Disability

Unemployment Among Ages 55 to 59 years Comparison

Scandinavians

Scottish

Exceptional
Exceptional
4.5%
UNEMPLOYMENT AMONG AGES 55 TO 59 YEARS
99.9/ 100
METRIC RATING
26th/ 347
METRIC RANK
4.5%
UNEMPLOYMENT AMONG AGES 55 TO 59 YEARS
99.7/ 100
METRIC RATING
52nd/ 347
METRIC RANK

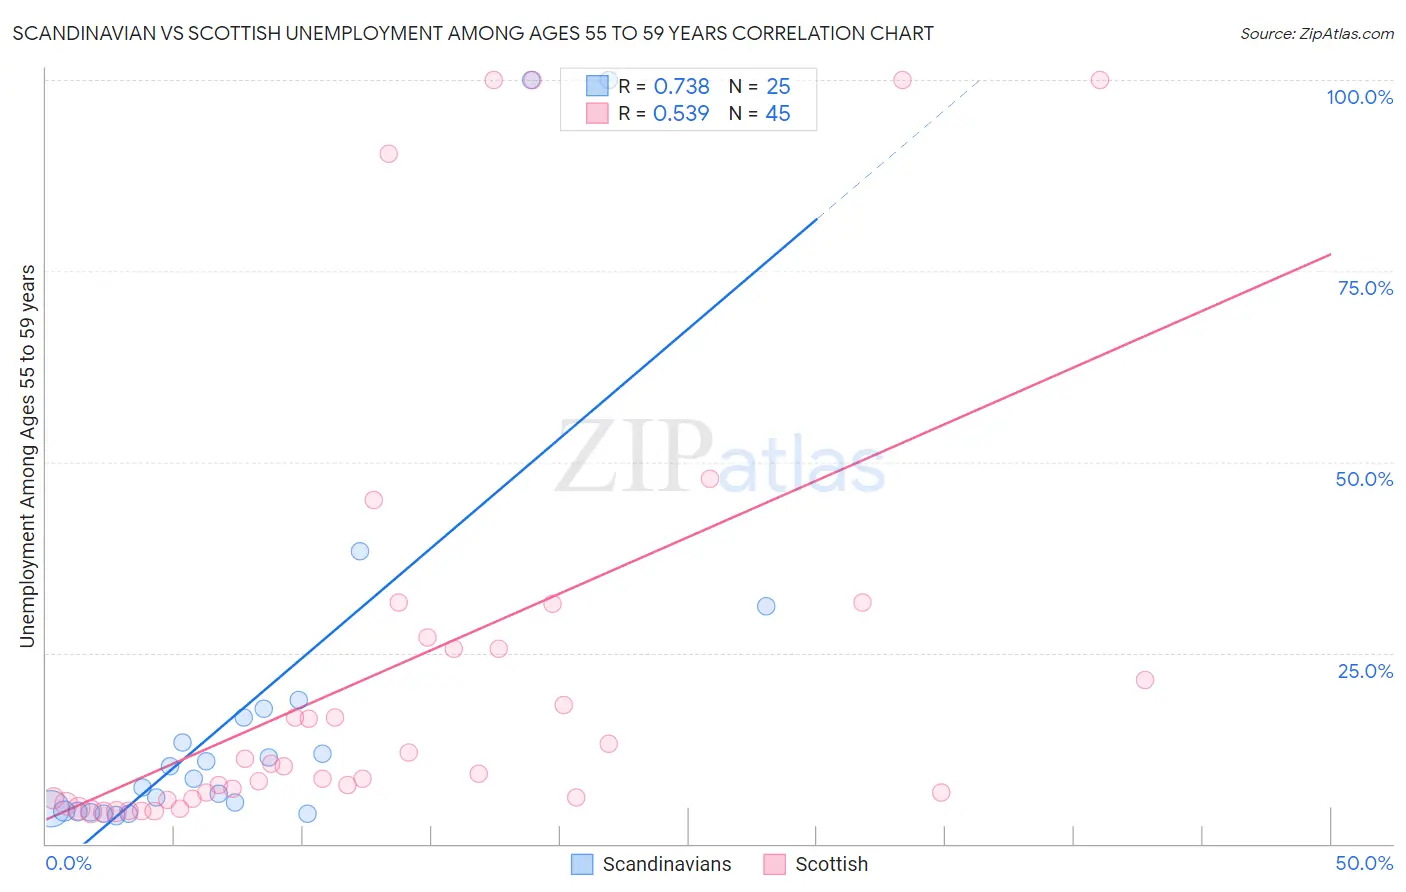
Scandinavian vs Scottish Unemployment Among Ages 55 to 59 years Correlation Chart

The statistical analysis conducted on geographies consisting of 420,169,317 people shows a strong positive correlation between the proportion of Scandinavians and unemployment rate among population between the ages 55 and 59 in the United States with a correlation coefficient (R) of 0.738 and weighted average of 4.5%. Similarly, the statistical analysis conducted on geographies consisting of 482,661,898 people shows a substantial positive correlation between the proportion of Scottish and unemployment rate among population between the ages 55 and 59 in the United States with a correlation coefficient (R) of 0.539 and weighted average of 4.5%, a difference of 1.9%.
Scandinavian vs Scottish Unemployment Among Ages 55 to 59 years

Unemployment Among Ages 55 to 59 years Correlation Summary

MeasurementScandinavianScottish
Minimum3.7%4.1%
Maximum100.0%100.0%
Range96.3%95.9%
Mean17.9%23.0%
Median8.5%10.2%
Interquartile 25% (IQ1)4.3%5.9%
Interquartile 75% (IQ3)17.1%26.3%
Interquartile Range (IQR)12.9%20.4%
Standard Deviation (Sample)26.2%28.9%
Standard Deviation (Population)25.6%28.6%

Similar Demographics by Unemployment Among Ages 55 to 59 years

Demographics Similar to Scandinavians by Unemployment Among Ages 55 to 59 years

In terms of unemployment among ages 55 to 59 years, the demographic groups most similar to Scandinavians are Immigrants from Zimbabwe (4.5%, a difference of 0.010%), Immigrants from Eastern Africa (4.5%, a difference of 0.060%), Palestinian (4.5%, a difference of 0.090%), Immigrants from Kenya (4.5%, a difference of 0.11%), and Immigrants from Eritrea (4.4%, a difference of 0.17%).
DemographicsRating | RankUnemployment Among Ages 55 to 59 years
Chinese
100.0
/100
|
#19
Exceptional
4.4%
Swedes
100.0
/100
|
#20
Exceptional
4.4%
Puget Sound Salish
100.0
/100
|
#21
Exceptional
4.4%
Immigrants | Burma/Myanmar
100.0
/100
|
#22
Exceptional
4.4%
Kenyans
100.0
/100
|
#23
Exceptional
4.4%
Jordanians
100.0
/100
|
#24
Exceptional
4.4%
Immigrants | Eritrea
100.0
/100
|
#25
Exceptional
4.4%
Scandinavians
99.9
/100
|
#26
Exceptional
4.5%
Immigrants | Zimbabwe
99.9
/100
|
#27
Exceptional
4.5%
Immigrants | Eastern Africa
99.9
/100
|
#28
Exceptional
4.5%
Palestinians
99.9
/100
|
#29
Exceptional
4.5%
Immigrants | Kenya
99.9
/100
|
#30
Exceptional
4.5%
Germans
99.9
/100
|
#31
Exceptional
4.5%
Immigrants | Ethiopia
99.9
/100
|
#32
Exceptional
4.5%
Belgians
99.9
/100
|
#33
Exceptional
4.5%

Demographics Similar to Scottish by Unemployment Among Ages 55 to 59 years

In terms of unemployment among ages 55 to 59 years, the demographic groups most similar to Scottish are Immigrants from Middle Africa (4.5%, a difference of 0.010%), Burmese (4.5%, a difference of 0.010%), Immigrants from Nepal (4.5%, a difference of 0.10%), Maltese (4.5%, a difference of 0.11%), and Immigrants from Pakistan (4.5%, a difference of 0.14%).
DemographicsRating | RankUnemployment Among Ages 55 to 59 years
British
99.8
/100
|
#45
Exceptional
4.5%
Immigrants | Zaire
99.8
/100
|
#46
Exceptional
4.5%
German Russians
99.8
/100
|
#47
Exceptional
4.5%
Immigrants | Moldova
99.7
/100
|
#48
Exceptional
4.5%
Immigrants | Saudi Arabia
99.7
/100
|
#49
Exceptional
4.5%
Immigrants | Pakistan
99.7
/100
|
#50
Exceptional
4.5%
Maltese
99.7
/100
|
#51
Exceptional
4.5%
Scottish
99.7
/100
|
#52
Exceptional
4.5%
Immigrants | Middle Africa
99.7
/100
|
#53
Exceptional
4.5%
Burmese
99.7
/100
|
#54
Exceptional
4.5%
Immigrants | Nepal
99.6
/100
|
#55
Exceptional
4.5%
Welsh
99.6
/100
|
#56
Exceptional
4.5%
Northern Europeans
99.6
/100
|
#57
Exceptional
4.5%
Okinawans
99.6
/100
|
#58
Exceptional
4.5%
Immigrants | Uganda
99.5
/100
|
#59
Exceptional
4.6%