Scandinavian vs Lithuanian Unemployment Among Ages 35 to 44 years

COMPARE

Scandinavian
Race
Ancestry
AfghanAfricanAlaska NativeAlaskan AthabascanAlbanianAleutAlsatianAmericanApacheArabArapahoArgentineanArmenianAssyrian/Chaldean/SyriacAustralianAustrianBahamianBangladeshiBarbadianBasqueBelgianBelizeanBermudanBhutaneseBlackfeetBolivianBrazilianBritishBritish West IndianBulgarianBurmeseCajunCambodianCanadianCape VerdeanCarpatho RusynCelticCentral AmericanCentral American IndianCherokeeCheyenneChickasawChileanChineseChippewaChoctawColombianColvilleComancheCosta RicanCreeCreekCroatianCrowCubanCypriotCzechCzechoslovakianDanishDelawareDominicanDutchDutch West IndianEastern EuropeanEcuadorianEgyptianEnglishEstonianEthiopianEuropeanFijianFilipinoFinnishFrenchFrench American IndianFrench CanadianGermanGerman RussianGhanaianGreekGuamanian/ChamorroGuatemalanGuyaneseHaitianHmongHonduranHopiHoumaHungarianIcelanderIndian (Asian)IndonesianInupiatIranianIraqiIrishIroquoisIsraeliItalianJamaicanJapaneseJordanianKenyanKiowaKoreanLaotianLatvianLebaneseLiberianLumbeeLuxembourgerMacedonianMalaysianMalteseMarshalleseMenomineeMexicanMexican American IndianMongolianMoroccanNative HawaiianNavajoNepaleseNew ZealanderNicaraguanNigerianNorthern EuropeanNorwegianOkinawanOsageOttawaPaiutePakistaniPalestinianPanamanianParaguayanPennsylvania GermanPeruvianPimaPolishPortuguesePotawatomiPuebloPuerto RicanPuget Sound SalishRomanianRussianSalvadoranSamoanScandinavianScotch-IrishScottishSeminoleSenegaleseSerbianShoshoneSierra LeoneanSiouxSlavicSlovakSloveneSomaliSouth AfricanSouth AmericanSouth American IndianSoviet UnionSpaniardSpanishSpanish AmericanSpanish American IndianSri LankanSubsaharan AfricanSudaneseSwedishSwissSyrianTaiwaneseThaiTlingit-HaidaTohono O'OdhamTonganTrinidadian and TobagonianTsimshianTurkishU.S. Virgin IslanderUgandanUkrainianUruguayanUteVenezuelanVietnameseWelshWest IndianYakamaYaquiYugoslavianYumanYup'ikZimbabwean
Immigration
NonimmigrantsImmigrantsAfghanistanAfricaAlbaniaArgentinaArmeniaAsiaAustraliaAustriaBahamasBangladeshBarbadosBelarusBelgiumBelizeBoliviaBosnia and HerzegovinaBrazilBulgariaBurma/MyanmarCabo VerdeCambodiaCameroonCanadaCaribbeanCentral AmericaChileChinaColombiaCongoCosta RicaCroatiaCubaCzechoslovakiaDenmarkDominicaDominican RepublicEastern AfricaEastern AsiaEastern EuropeEcuadorEgyptEl SalvadorEnglandEritreaEthiopiaEuropeFijiFranceGermanyGhanaGreeceGrenadaGuatemalaGuyanaHaitiHondurasHong KongHungaryIndiaIndonesiaIranIraqIrelandIsraelItalyJamaicaJapanJordanKazakhstanKenyaKoreaKuwaitLaosLatin AmericaLatviaLebanonLiberiaLithuaniaMalaysiaMexicoMicronesiaMiddle AfricaMoldovaMoroccoNepalNetherlandsNicaraguaNigeriaNorth AmericaNorth MacedoniaNorthern AfricaNorthern EuropeNorwayOceaniaPakistanPanamaPeruPhilippinesPolandPortugalRomaniaRussiaSaudi ArabiaScotlandSenegalSerbiaSierra LeoneSingaporeSomaliaSouth AfricaSouth AmericaSouth Central AsiaSouth Eastern AsiaSouthern EuropeSpainSri LankaSt. Vincent and the GrenadinesSudanSwedenSwitzerlandSyriaTaiwanThailandTrinidad and TobagoTurkeyUgandaUkraineUruguayUzbekistanVenezuelaVietnamWest IndiesWestern AfricaWestern AsiaWestern EuropeYemenZaireZimbabweAzores
Lithuanian
Race
Ancestry
AfghanAfricanAlaska NativeAlaskan AthabascanAlbanianAleutAlsatianAmericanApacheArabArapahoArgentineanArmenianAssyrian/Chaldean/SyriacAustralianAustrianBahamianBangladeshiBarbadianBasqueBelgianBelizeanBermudanBhutaneseBlackfeetBolivianBrazilianBritishBritish West IndianBulgarianBurmeseCajunCambodianCanadianCape VerdeanCarpatho RusynCelticCentral AmericanCentral American IndianCherokeeCheyenneChickasawChileanChineseChippewaChoctawColombianColvilleComancheCosta RicanCreeCreekCroatianCrowCubanCypriotCzechCzechoslovakianDanishDelawareDominicanDutchDutch West IndianEastern EuropeanEcuadorianEgyptianEnglishEstonianEthiopianEuropeanFijianFilipinoFinnishFrenchFrench American IndianFrench CanadianGermanGerman RussianGhanaianGreekGuamanian/ChamorroGuatemalanGuyaneseHaitianHmongHonduranHopiHoumaHungarianIcelanderIndian (Asian)IndonesianInupiatIranianIraqiIrishIroquoisIsraeliItalianJamaicanJapaneseJordanianKenyanKiowaKoreanLaotianLatvianLebaneseLiberianLithuanianLumbeeLuxembourgerMacedonianMalaysianMalteseMarshalleseMenomineeMexicanMexican American IndianMongolianMoroccanNative HawaiianNavajoNepaleseNew ZealanderNicaraguanNigerianNorthern EuropeanNorwegianOkinawanOsageOttawaPaiutePakistaniPalestinianPanamanianParaguayanPennsylvania GermanPeruvianPimaPolishPortuguesePotawatomiPuebloPuerto RicanPuget Sound SalishRomanianRussianSalvadoranSamoanScotch-IrishScottishSeminoleSenegaleseSerbianShoshoneSierra LeoneanSiouxSlavicSlovakSloveneSomaliSouth AfricanSouth AmericanSouth American IndianSoviet UnionSpaniardSpanishSpanish AmericanSpanish American IndianSri LankanSubsaharan AfricanSudaneseSwedishSwissSyrianTaiwaneseThaiTlingit-HaidaTohono O'OdhamTonganTrinidadian and TobagonianTsimshianTurkishU.S. Virgin IslanderUgandanUkrainianUruguayanUteVenezuelanVietnameseWelshWest IndianYakamaYaquiYugoslavianYumanYup'ikZimbabwean
Immigration
NonimmigrantsImmigrantsAfghanistanAfricaAlbaniaArgentinaArmeniaAsiaAustraliaAustriaBahamasBangladeshBarbadosBelarusBelgiumBelizeBoliviaBosnia and HerzegovinaBrazilBulgariaBurma/MyanmarCabo VerdeCambodiaCameroonCanadaCaribbeanCentral AmericaChileChinaColombiaCongoCosta RicaCroatiaCubaCzechoslovakiaDenmarkDominicaDominican RepublicEastern AfricaEastern AsiaEastern EuropeEcuadorEgyptEl SalvadorEnglandEritreaEthiopiaEuropeFijiFranceGermanyGhanaGreeceGrenadaGuatemalaGuyanaHaitiHondurasHong KongHungaryIndiaIndonesiaIranIraqIrelandIsraelItalyJamaicaJapanJordanKazakhstanKenyaKoreaKuwaitLaosLatin AmericaLatviaLebanonLiberiaLithuaniaMalaysiaMexicoMicronesiaMiddle AfricaMoldovaMoroccoNepalNetherlandsNicaraguaNigeriaNorth AmericaNorth MacedoniaNorthern AfricaNorthern EuropeNorwayOceaniaPakistanPanamaPeruPhilippinesPolandPortugalRomaniaRussiaSaudi ArabiaScotlandSenegalSerbiaSierra LeoneSingaporeSomaliaSouth AfricaSouth AmericaSouth Central AsiaSouth Eastern AsiaSouthern EuropeSpainSri LankaSt. Vincent and the GrenadinesSudanSwedenSwitzerlandSyriaTaiwanThailandTrinidad and TobagoTurkeyUgandaUkraineUruguayUzbekistanVenezuelaVietnamWest IndiesWestern AfricaWestern AsiaWestern EuropeYemenZaireZimbabweAzores
Unemployment Among Ages 35 to 44 years
Income
Poverty
Unemployment
Labor Participation
Family Structure
Vehicle Availability
Education Level
Disability

Unemployment Among Ages 35 to 44 years Comparison

Scandinavians

Lithuanians

Exceptional
Exceptional
4.2%
UNEMPLOYMENT AMONG AGES 35 TO 44 YEARS
99.5/ 100
METRIC RATING
22nd/ 347
METRIC RANK
4.4%
UNEMPLOYMENT AMONG AGES 35 TO 44 YEARS
96.5/ 100
METRIC RATING
73rd/ 347
METRIC RANK

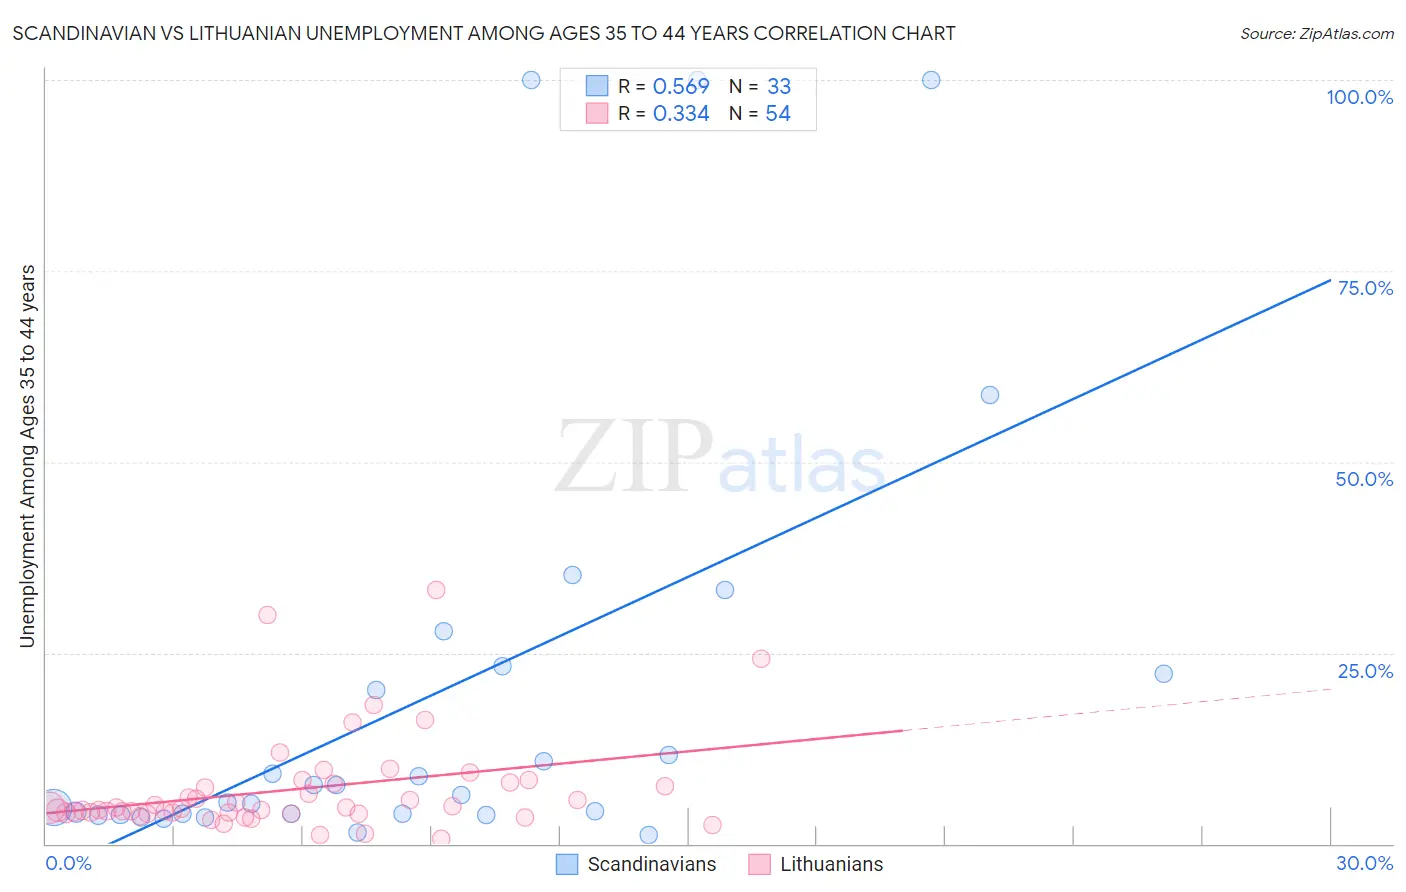
Scandinavian vs Lithuanian Unemployment Among Ages 35 to 44 years Correlation Chart

The statistical analysis conducted on geographies consisting of 451,392,438 people shows a substantial positive correlation between the proportion of Scandinavians and unemployment rate among population between the ages 35 and 44 in the United States with a correlation coefficient (R) of 0.569 and weighted average of 4.2%. Similarly, the statistical analysis conducted on geographies consisting of 407,593,910 people shows a mild positive correlation between the proportion of Lithuanians and unemployment rate among population between the ages 35 and 44 in the United States with a correlation coefficient (R) of 0.334 and weighted average of 4.4%, a difference of 4.0%.
Scandinavian vs Lithuanian Unemployment Among Ages 35 to 44 years

Unemployment Among Ages 35 to 44 years Correlation Summary

MeasurementScandinavianLithuanian
Minimum1.1%0.70%
Maximum100.0%33.3%
Range98.9%32.6%
Mean19.5%7.1%
Median6.3%4.6%
Interquartile 25% (IQ1)3.8%4.0%
Interquartile 75% (IQ3)22.7%7.9%
Interquartile Range (IQR)18.9%3.9%
Standard Deviation (Sample)28.7%6.5%
Standard Deviation (Population)28.2%6.4%

Similar Demographics by Unemployment Among Ages 35 to 44 years

Demographics Similar to Scandinavians by Unemployment Among Ages 35 to 44 years

In terms of unemployment among ages 35 to 44 years, the demographic groups most similar to Scandinavians are Immigrants from Kuwait (4.3%, a difference of 0.15%), Tlingit-Haida (4.3%, a difference of 0.16%), Paraguayan (4.2%, a difference of 0.26%), Bulgarian (4.3%, a difference of 0.63%), and Turkish (4.3%, a difference of 0.69%).
DemographicsRating | RankUnemployment Among Ages 35 to 44 years
Tongans
99.8
/100
|
#15
Exceptional
4.2%
Cubans
99.8
/100
|
#16
Exceptional
4.2%
Swedes
99.8
/100
|
#17
Exceptional
4.2%
Latvians
99.8
/100
|
#18
Exceptional
4.2%
Immigrants | Nepal
99.7
/100
|
#19
Exceptional
4.2%
Immigrants | Bolivia
99.7
/100
|
#20
Exceptional
4.2%
Paraguayans
99.6
/100
|
#21
Exceptional
4.2%
Scandinavians
99.5
/100
|
#22
Exceptional
4.2%
Immigrants | Kuwait
99.5
/100
|
#23
Exceptional
4.3%
Tlingit-Haida
99.5
/100
|
#24
Exceptional
4.3%
Bulgarians
99.3
/100
|
#25
Exceptional
4.3%
Turks
99.3
/100
|
#26
Exceptional
4.3%
Assyrians/Chaldeans/Syriacs
99.3
/100
|
#27
Exceptional
4.3%
Immigrants | Japan
99.3
/100
|
#28
Exceptional
4.3%
Europeans
99.2
/100
|
#29
Exceptional
4.3%

Demographics Similar to Lithuanians by Unemployment Among Ages 35 to 44 years

In terms of unemployment among ages 35 to 44 years, the demographic groups most similar to Lithuanians are Northern European (4.4%, a difference of 0.030%), Polish (4.4%, a difference of 0.040%), Immigrants from Romania (4.4%, a difference of 0.060%), Immigrants from Jordan (4.4%, a difference of 0.090%), and Slovene (4.4%, a difference of 0.15%).
DemographicsRating | RankUnemployment Among Ages 35 to 44 years
Icelanders
96.8
/100
|
#66
Exceptional
4.4%
Argentineans
96.8
/100
|
#67
Exceptional
4.4%
Immigrants | Ireland
96.8
/100
|
#68
Exceptional
4.4%
Slovenes
96.7
/100
|
#69
Exceptional
4.4%
Immigrants | China
96.7
/100
|
#70
Exceptional
4.4%
Immigrants | Lithuania
96.7
/100
|
#71
Exceptional
4.4%
Northern Europeans
96.5
/100
|
#72
Exceptional
4.4%
Lithuanians
96.5
/100
|
#73
Exceptional
4.4%
Poles
96.4
/100
|
#74
Exceptional
4.4%
Immigrants | Romania
96.3
/100
|
#75
Exceptional
4.4%
Immigrants | Jordan
96.3
/100
|
#76
Exceptional
4.4%
Dutch
96.1
/100
|
#77
Exceptional
4.4%
Indians (Asian)
96.0
/100
|
#78
Exceptional
4.4%
Immigrants | Sweden
95.9
/100
|
#79
Exceptional
4.4%
Kenyans
95.7
/100
|
#80
Exceptional
4.4%