Samoan vs Spanish American Unemployment Among Ages 60 to 64 years

COMPARE

Samoan
Race
Ancestry
AfghanAfricanAlaska NativeAlaskan AthabascanAlbanianAleutAlsatianAmericanApacheArabArapahoArgentineanArmenianAssyrian/Chaldean/SyriacAustralianAustrianBahamianBangladeshiBarbadianBasqueBelgianBelizeanBermudanBhutaneseBlackfeetBolivianBrazilianBritishBritish West IndianBulgarianBurmeseCajunCambodianCanadianCape VerdeanCarpatho RusynCelticCentral AmericanCentral American IndianCherokeeCheyenneChickasawChileanChineseChippewaChoctawColombianColvilleComancheCosta RicanCreeCreekCroatianCrowCubanCypriotCzechCzechoslovakianDanishDelawareDominicanDutchDutch West IndianEastern EuropeanEcuadorianEgyptianEnglishEstonianEthiopianEuropeanFijianFilipinoFinnishFrenchFrench American IndianFrench CanadianGermanGerman RussianGhanaianGreekGuamanian/ChamorroGuatemalanGuyaneseHaitianHmongHonduranHopiHoumaHungarianIcelanderIndian (Asian)IndonesianInupiatIranianIraqiIrishIroquoisIsraeliItalianJamaicanJapaneseJordanianKenyanKiowaKoreanLaotianLatvianLebaneseLiberianLithuanianLumbeeLuxembourgerMacedonianMalaysianMalteseMarshalleseMenomineeMexicanMexican American IndianMongolianMoroccanNative HawaiianNavajoNepaleseNew ZealanderNicaraguanNigerianNorthern EuropeanNorwegianOkinawanOsageOttawaPaiutePakistaniPalestinianPanamanianParaguayanPennsylvania GermanPeruvianPimaPolishPortuguesePotawatomiPuebloPuerto RicanPuget Sound SalishRomanianRussianSalvadoranSamoanScandinavianScotch-IrishScottishSeminoleSenegaleseSerbianShoshoneSierra LeoneanSiouxSlavicSlovakSloveneSomaliSouth AfricanSouth AmericanSouth American IndianSoviet UnionSpaniardSpanishSpanish American IndianSri LankanSubsaharan AfricanSudaneseSwedishSwissSyrianTaiwaneseThaiTlingit-HaidaTohono O'OdhamTonganTrinidadian and TobagonianTsimshianTurkishU.S. Virgin IslanderUgandanUkrainianUruguayanUteVenezuelanVietnameseWelshWest IndianYakamaYaquiYugoslavianYumanYup'ikZimbabwean
Immigration
NonimmigrantsImmigrantsAfghanistanAfricaAlbaniaArgentinaArmeniaAsiaAustraliaAustriaBahamasBangladeshBarbadosBelarusBelgiumBelizeBoliviaBosnia and HerzegovinaBrazilBulgariaBurma/MyanmarCabo VerdeCambodiaCameroonCanadaCaribbeanCentral AmericaChileChinaColombiaCongoCosta RicaCroatiaCubaCzechoslovakiaDenmarkDominicaDominican RepublicEastern AfricaEastern AsiaEastern EuropeEcuadorEgyptEl SalvadorEnglandEritreaEthiopiaEuropeFijiFranceGermanyGhanaGreeceGrenadaGuatemalaGuyanaHaitiHondurasHong KongHungaryIndiaIndonesiaIranIraqIrelandIsraelItalyJamaicaJapanJordanKazakhstanKenyaKoreaKuwaitLaosLatin AmericaLatviaLebanonLiberiaLithuaniaMalaysiaMexicoMicronesiaMiddle AfricaMoldovaMoroccoNepalNetherlandsNicaraguaNigeriaNorth AmericaNorth MacedoniaNorthern AfricaNorthern EuropeNorwayOceaniaPakistanPanamaPeruPhilippinesPolandPortugalRomaniaRussiaSaudi ArabiaScotlandSenegalSerbiaSierra LeoneSingaporeSomaliaSouth AfricaSouth AmericaSouth Central AsiaSouth Eastern AsiaSouthern EuropeSpainSri LankaSt. Vincent and the GrenadinesSudanSwedenSwitzerlandSyriaTaiwanThailandTrinidad and TobagoTurkeyUgandaUkraineUruguayUzbekistanVenezuelaVietnamWest IndiesWestern AfricaWestern AsiaWestern EuropeYemenZaireZimbabweAzores
Spanish American
Race
Ancestry
AfghanAfricanAlaska NativeAlaskan AthabascanAlbanianAleutAlsatianAmericanApacheArabArapahoArgentineanArmenianAssyrian/Chaldean/SyriacAustralianAustrianBahamianBangladeshiBarbadianBasqueBelgianBelizeanBermudanBhutaneseBlackfeetBolivianBrazilianBritishBritish West IndianBulgarianBurmeseCajunCambodianCanadianCape VerdeanCarpatho RusynCelticCentral AmericanCentral American IndianCherokeeCheyenneChickasawChileanChineseChippewaChoctawColombianColvilleComancheCosta RicanCreeCreekCroatianCrowCubanCypriotCzechCzechoslovakianDanishDelawareDominicanDutchDutch West IndianEastern EuropeanEcuadorianEgyptianEnglishEstonianEthiopianEuropeanFijianFilipinoFinnishFrenchFrench American IndianFrench CanadianGermanGerman RussianGhanaianGreekGuamanian/ChamorroGuatemalanGuyaneseHaitianHmongHonduranHopiHoumaHungarianIcelanderIndian (Asian)IndonesianInupiatIranianIraqiIrishIroquoisIsraeliItalianJamaicanJapaneseJordanianKenyanKiowaKoreanLaotianLatvianLebaneseLiberianLithuanianLumbeeLuxembourgerMacedonianMalaysianMalteseMarshalleseMenomineeMexicanMexican American IndianMongolianMoroccanNative HawaiianNavajoNepaleseNew ZealanderNicaraguanNigerianNorthern EuropeanNorwegianOkinawanOsageOttawaPaiutePakistaniPalestinianPanamanianParaguayanPennsylvania GermanPeruvianPimaPolishPortuguesePotawatomiPuebloPuerto RicanPuget Sound SalishRomanianRussianSalvadoranScandinavianScotch-IrishScottishSeminoleSenegaleseSerbianShoshoneSierra LeoneanSiouxSlavicSlovakSloveneSomaliSouth AfricanSouth AmericanSouth American IndianSoviet UnionSpaniardSpanishSpanish AmericanSpanish American IndianSri LankanSubsaharan AfricanSudaneseSwedishSwissSyrianTaiwaneseThaiTlingit-HaidaTohono O'OdhamTonganTrinidadian and TobagonianTsimshianTurkishU.S. Virgin IslanderUgandanUkrainianUruguayanUteVenezuelanVietnameseWelshWest IndianYakamaYaquiYugoslavianYumanYup'ikZimbabwean
Immigration
NonimmigrantsImmigrantsAfghanistanAfricaAlbaniaArgentinaArmeniaAsiaAustraliaAustriaBahamasBangladeshBarbadosBelarusBelgiumBelizeBoliviaBosnia and HerzegovinaBrazilBulgariaBurma/MyanmarCabo VerdeCambodiaCameroonCanadaCaribbeanCentral AmericaChileChinaColombiaCongoCosta RicaCroatiaCubaCzechoslovakiaDenmarkDominicaDominican RepublicEastern AfricaEastern AsiaEastern EuropeEcuadorEgyptEl SalvadorEnglandEritreaEthiopiaEuropeFijiFranceGermanyGhanaGreeceGrenadaGuatemalaGuyanaHaitiHondurasHong KongHungaryIndiaIndonesiaIranIraqIrelandIsraelItalyJamaicaJapanJordanKazakhstanKenyaKoreaKuwaitLaosLatin AmericaLatviaLebanonLiberiaLithuaniaMalaysiaMexicoMicronesiaMiddle AfricaMoldovaMoroccoNepalNetherlandsNicaraguaNigeriaNorth AmericaNorth MacedoniaNorthern AfricaNorthern EuropeNorwayOceaniaPakistanPanamaPeruPhilippinesPolandPortugalRomaniaRussiaSaudi ArabiaScotlandSenegalSerbiaSierra LeoneSingaporeSomaliaSouth AfricaSouth AmericaSouth Central AsiaSouth Eastern AsiaSouthern EuropeSpainSri LankaSt. Vincent and the GrenadinesSudanSwedenSwitzerlandSyriaTaiwanThailandTrinidad and TobagoTurkeyUgandaUkraineUruguayUzbekistanVenezuelaVietnamWest IndiesWestern AfricaWestern AsiaWestern EuropeYemenZaireZimbabweAzores
Unemployment Among Ages 60 to 64 years
Income
Poverty
Unemployment
Labor Participation
Family Structure
Vehicle Availability
Education Level
Disability

Unemployment Among Ages 60 to 64 years Comparison

Samoans

Spanish Americans

Average
Tragic
4.9%
UNEMPLOYMENT AMONG AGES 60 TO 64 YEARS
53.6/ 100
METRIC RATING
171st/ 347
METRIC RANK
5.3%
UNEMPLOYMENT AMONG AGES 60 TO 64 YEARS
0.0/ 100
METRIC RATING
289th/ 347
METRIC RANK

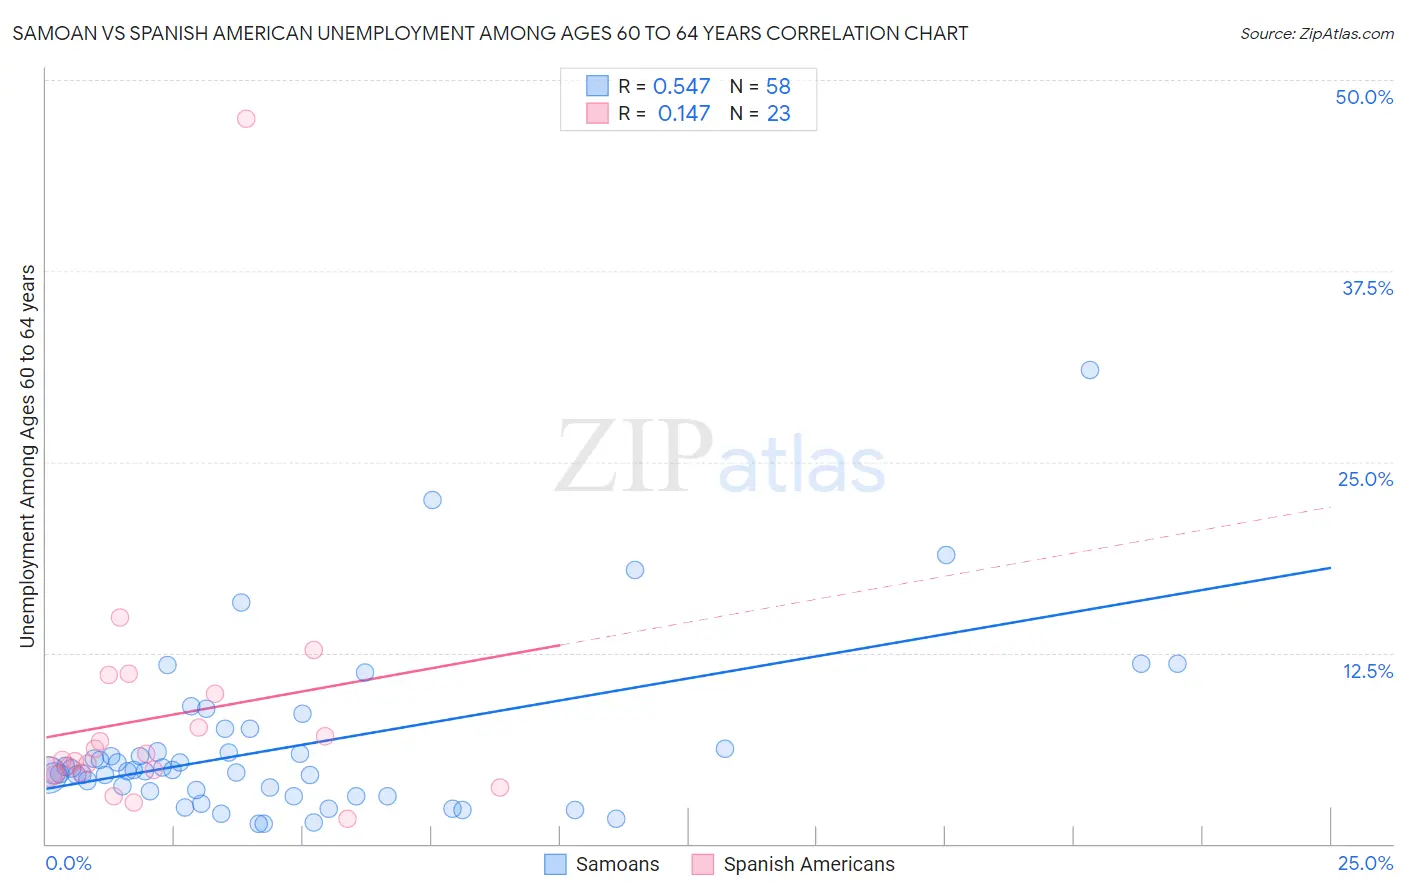
Samoan vs Spanish American Unemployment Among Ages 60 to 64 years Correlation Chart

The statistical analysis conducted on geographies consisting of 211,154,134 people shows a substantial positive correlation between the proportion of Samoans and unemployment rate among population between the ages 60 and 64 in the United States with a correlation coefficient (R) of 0.547 and weighted average of 4.9%. Similarly, the statistical analysis conducted on geographies consisting of 100,266,339 people shows a poor positive correlation between the proportion of Spanish Americans and unemployment rate among population between the ages 60 and 64 in the United States with a correlation coefficient (R) of 0.147 and weighted average of 5.3%, a difference of 9.1%.
Samoan vs Spanish American Unemployment Among Ages 60 to 64 years

Unemployment Among Ages 60 to 64 years Correlation Summary

MeasurementSamoanSpanish American
Minimum1.3%1.6%
Maximum31.0%47.5%
Range29.7%45.9%
Mean6.4%8.3%
Median4.8%5.5%
Interquartile 25% (IQ1)3.4%4.6%
Interquartile 75% (IQ3)6.2%9.8%
Interquartile Range (IQR)2.8%5.2%
Standard Deviation (Sample)5.5%9.2%
Standard Deviation (Population)5.4%9.0%

Similar Demographics by Unemployment Among Ages 60 to 64 years

Demographics Similar to Samoans by Unemployment Among Ages 60 to 64 years

In terms of unemployment among ages 60 to 64 years, the demographic groups most similar to Samoans are Immigrants from Korea (4.8%, a difference of 0.020%), Immigrants from Turkey (4.9%, a difference of 0.030%), Immigrants from France (4.8%, a difference of 0.070%), Immigrants from Southern Europe (4.8%, a difference of 0.11%), and Immigrants from Hungary (4.9%, a difference of 0.12%).
DemographicsRating | RankUnemployment Among Ages 60 to 64 years
Pakistanis
64.6
/100
|
#164
Good
4.8%
Immigrants | Panama
62.0
/100
|
#165
Good
4.8%
Palestinians
60.5
/100
|
#166
Good
4.8%
Immigrants | Northern Europe
59.1
/100
|
#167
Average
4.8%
Immigrants | Southern Europe
56.7
/100
|
#168
Average
4.8%
Immigrants | France
55.5
/100
|
#169
Average
4.8%
Immigrants | Korea
54.2
/100
|
#170
Average
4.8%
Samoans
53.6
/100
|
#171
Average
4.9%
Immigrants | Turkey
52.8
/100
|
#172
Average
4.9%
Immigrants | Hungary
50.2
/100
|
#173
Average
4.9%
Immigrants | Western Europe
50.0
/100
|
#174
Average
4.9%
Immigrants | Latvia
46.9
/100
|
#175
Average
4.9%
Bermudans
46.5
/100
|
#176
Average
4.9%
Immigrants | Malaysia
44.7
/100
|
#177
Average
4.9%
Immigrants | Nonimmigrants
44.5
/100
|
#178
Average
4.9%

Demographics Similar to Spanish Americans by Unemployment Among Ages 60 to 64 years

In terms of unemployment among ages 60 to 64 years, the demographic groups most similar to Spanish Americans are Trinidadian and Tobagonian (5.3%, a difference of 0.030%), Immigrants from Trinidad and Tobago (5.3%, a difference of 0.030%), Salvadoran (5.3%, a difference of 0.21%), Mexican American Indian (5.3%, a difference of 0.25%), and Hispanic or Latino (5.3%, a difference of 0.35%).
DemographicsRating | RankUnemployment Among Ages 60 to 64 years
Mexicans
0.0
/100
|
#282
Tragic
5.2%
Immigrants | Guatemala
0.0
/100
|
#283
Tragic
5.3%
Taiwanese
0.0
/100
|
#284
Tragic
5.3%
West Indians
0.0
/100
|
#285
Tragic
5.3%
Mexican American Indians
0.0
/100
|
#286
Tragic
5.3%
Salvadorans
0.0
/100
|
#287
Tragic
5.3%
Trinidadians and Tobagonians
0.0
/100
|
#288
Tragic
5.3%
Spanish Americans
0.0
/100
|
#289
Tragic
5.3%
Immigrants | Trinidad and Tobago
0.0
/100
|
#290
Tragic
5.3%
Hispanics or Latinos
0.0
/100
|
#291
Tragic
5.3%
Immigrants | Latin America
0.0
/100
|
#292
Tragic
5.3%
Immigrants | Israel
0.0
/100
|
#293
Tragic
5.3%
Blacks/African Americans
0.0
/100
|
#294
Tragic
5.3%
Armenians
0.0
/100
|
#295
Tragic
5.3%
Jamaicans
0.0
/100
|
#296
Tragic
5.3%