Samoan vs Panamanian Unemployment Among Ages 20 to 24 years

COMPARE

Samoan
Race
Ancestry
AfghanAfricanAlaska NativeAlaskan AthabascanAlbanianAleutAlsatianAmericanApacheArabArapahoArgentineanArmenianAssyrian/Chaldean/SyriacAustralianAustrianBahamianBangladeshiBarbadianBasqueBelgianBelizeanBermudanBhutaneseBlackfeetBolivianBrazilianBritishBritish West IndianBulgarianBurmeseCajunCambodianCanadianCape VerdeanCarpatho RusynCelticCentral AmericanCentral American IndianCherokeeCheyenneChickasawChileanChineseChippewaChoctawColombianColvilleComancheCosta RicanCreeCreekCroatianCrowCubanCypriotCzechCzechoslovakianDanishDelawareDominicanDutchDutch West IndianEastern EuropeanEcuadorianEgyptianEnglishEstonianEthiopianEuropeanFijianFilipinoFinnishFrenchFrench American IndianFrench CanadianGermanGerman RussianGhanaianGreekGuamanian/ChamorroGuatemalanGuyaneseHaitianHmongHonduranHopiHoumaHungarianIcelanderIndian (Asian)IndonesianInupiatIranianIraqiIrishIroquoisIsraeliItalianJamaicanJapaneseJordanianKenyanKiowaKoreanLaotianLatvianLebaneseLiberianLithuanianLumbeeLuxembourgerMacedonianMalaysianMalteseMarshalleseMenomineeMexicanMexican American IndianMongolianMoroccanNative HawaiianNavajoNepaleseNew ZealanderNicaraguanNigerianNorthern EuropeanNorwegianOkinawanOsageOttawaPaiutePakistaniPalestinianParaguayanPennsylvania GermanPeruvianPimaPolishPortuguesePotawatomiPuebloPuerto RicanPuget Sound SalishRomanianRussianSalvadoranSamoanScandinavianScotch-IrishScottishSeminoleSenegaleseSerbianShoshoneSierra LeoneanSiouxSlavicSlovakSloveneSomaliSouth AfricanSouth AmericanSouth American IndianSoviet UnionSpaniardSpanishSpanish AmericanSpanish American IndianSri LankanSubsaharan AfricanSudaneseSwedishSwissSyrianTaiwaneseThaiTlingit-HaidaTohono O'OdhamTonganTrinidadian and TobagonianTsimshianTurkishU.S. Virgin IslanderUgandanUkrainianUruguayanUteVenezuelanVietnameseWelshWest IndianYakamaYaquiYugoslavianYumanYup'ikZimbabwean
Immigration
NonimmigrantsImmigrantsAfghanistanAfricaAlbaniaArgentinaArmeniaAsiaAustraliaAustriaBahamasBangladeshBarbadosBelarusBelgiumBelizeBoliviaBosnia and HerzegovinaBrazilBulgariaBurma/MyanmarCabo VerdeCambodiaCameroonCanadaCaribbeanCentral AmericaChileChinaColombiaCongoCosta RicaCroatiaCubaCzechoslovakiaDenmarkDominicaDominican RepublicEastern AfricaEastern AsiaEastern EuropeEcuadorEgyptEl SalvadorEnglandEritreaEthiopiaEuropeFijiFranceGermanyGhanaGreeceGrenadaGuatemalaGuyanaHaitiHondurasHong KongHungaryIndiaIndonesiaIranIraqIrelandIsraelItalyJamaicaJapanJordanKazakhstanKenyaKoreaKuwaitLaosLatin AmericaLatviaLebanonLiberiaLithuaniaMalaysiaMexicoMicronesiaMiddle AfricaMoldovaMoroccoNepalNetherlandsNicaraguaNigeriaNorth AmericaNorth MacedoniaNorthern AfricaNorthern EuropeNorwayOceaniaPakistanPanamaPeruPhilippinesPolandPortugalRomaniaRussiaSaudi ArabiaScotlandSenegalSerbiaSierra LeoneSingaporeSomaliaSouth AfricaSouth AmericaSouth Central AsiaSouth Eastern AsiaSouthern EuropeSpainSri LankaSt. Vincent and the GrenadinesSudanSwedenSwitzerlandSyriaTaiwanThailandTrinidad and TobagoTurkeyUgandaUkraineUruguayUzbekistanVenezuelaVietnamWest IndiesWestern AfricaWestern AsiaWestern EuropeYemenZaireZimbabweAzores
Panamanian
Race
Ancestry
AfghanAfricanAlaska NativeAlaskan AthabascanAlbanianAleutAlsatianAmericanApacheArabArapahoArgentineanArmenianAssyrian/Chaldean/SyriacAustralianAustrianBahamianBangladeshiBarbadianBasqueBelgianBelizeanBermudanBhutaneseBlackfeetBolivianBrazilianBritishBritish West IndianBulgarianBurmeseCajunCambodianCanadianCape VerdeanCarpatho RusynCelticCentral AmericanCentral American IndianCherokeeCheyenneChickasawChileanChineseChippewaChoctawColombianColvilleComancheCosta RicanCreeCreekCroatianCrowCubanCypriotCzechCzechoslovakianDanishDelawareDominicanDutchDutch West IndianEastern EuropeanEcuadorianEgyptianEnglishEstonianEthiopianEuropeanFijianFilipinoFinnishFrenchFrench American IndianFrench CanadianGermanGerman RussianGhanaianGreekGuamanian/ChamorroGuatemalanGuyaneseHaitianHmongHonduranHopiHoumaHungarianIcelanderIndian (Asian)IndonesianInupiatIranianIraqiIrishIroquoisIsraeliItalianJamaicanJapaneseJordanianKenyanKiowaKoreanLaotianLatvianLebaneseLiberianLithuanianLumbeeLuxembourgerMacedonianMalaysianMalteseMarshalleseMenomineeMexicanMexican American IndianMongolianMoroccanNative HawaiianNavajoNepaleseNew ZealanderNicaraguanNigerianNorthern EuropeanNorwegianOkinawanOsageOttawaPaiutePakistaniPalestinianPanamanianParaguayanPennsylvania GermanPeruvianPimaPolishPortuguesePotawatomiPuebloPuerto RicanPuget Sound SalishRomanianRussianSalvadoranScandinavianScotch-IrishScottishSeminoleSenegaleseSerbianShoshoneSierra LeoneanSiouxSlavicSlovakSloveneSomaliSouth AfricanSouth AmericanSouth American IndianSoviet UnionSpaniardSpanishSpanish AmericanSpanish American IndianSri LankanSubsaharan AfricanSudaneseSwedishSwissSyrianTaiwaneseThaiTlingit-HaidaTohono O'OdhamTonganTrinidadian and TobagonianTsimshianTurkishU.S. Virgin IslanderUgandanUkrainianUruguayanUteVenezuelanVietnameseWelshWest IndianYakamaYaquiYugoslavianYumanYup'ikZimbabwean
Immigration
NonimmigrantsImmigrantsAfghanistanAfricaAlbaniaArgentinaArmeniaAsiaAustraliaAustriaBahamasBangladeshBarbadosBelarusBelgiumBelizeBoliviaBosnia and HerzegovinaBrazilBulgariaBurma/MyanmarCabo VerdeCambodiaCameroonCanadaCaribbeanCentral AmericaChileChinaColombiaCongoCosta RicaCroatiaCubaCzechoslovakiaDenmarkDominicaDominican RepublicEastern AfricaEastern AsiaEastern EuropeEcuadorEgyptEl SalvadorEnglandEritreaEthiopiaEuropeFijiFranceGermanyGhanaGreeceGrenadaGuatemalaGuyanaHaitiHondurasHong KongHungaryIndiaIndonesiaIranIraqIrelandIsraelItalyJamaicaJapanJordanKazakhstanKenyaKoreaKuwaitLaosLatin AmericaLatviaLebanonLiberiaLithuaniaMalaysiaMexicoMicronesiaMiddle AfricaMoldovaMoroccoNepalNetherlandsNicaraguaNigeriaNorth AmericaNorth MacedoniaNorthern AfricaNorthern EuropeNorwayOceaniaPakistanPanamaPeruPhilippinesPolandPortugalRomaniaRussiaSaudi ArabiaScotlandSenegalSerbiaSierra LeoneSingaporeSomaliaSouth AfricaSouth AmericaSouth Central AsiaSouth Eastern AsiaSouthern EuropeSpainSri LankaSt. Vincent and the GrenadinesSudanSwedenSwitzerlandSyriaTaiwanThailandTrinidad and TobagoTurkeyUgandaUkraineUruguayUzbekistanVenezuelaVietnamWest IndiesWestern AfricaWestern AsiaWestern EuropeYemenZaireZimbabweAzores
Unemployment Among Ages 20 to 24 years
Income
Poverty
Unemployment
Labor Participation
Family Structure
Vehicle Availability
Education Level
Disability

Unemployment Among Ages 20 to 24 years Comparison

Samoans

Panamanians

Average
Tragic
10.3%
UNEMPLOYMENT AMONG AGES 20 TO 24 YEARS
45.4/ 100
METRIC RATING
175th/ 347
METRIC RANK
10.9%
UNEMPLOYMENT AMONG AGES 20 TO 24 YEARS
0.2/ 100
METRIC RATING
259th/ 347
METRIC RANK

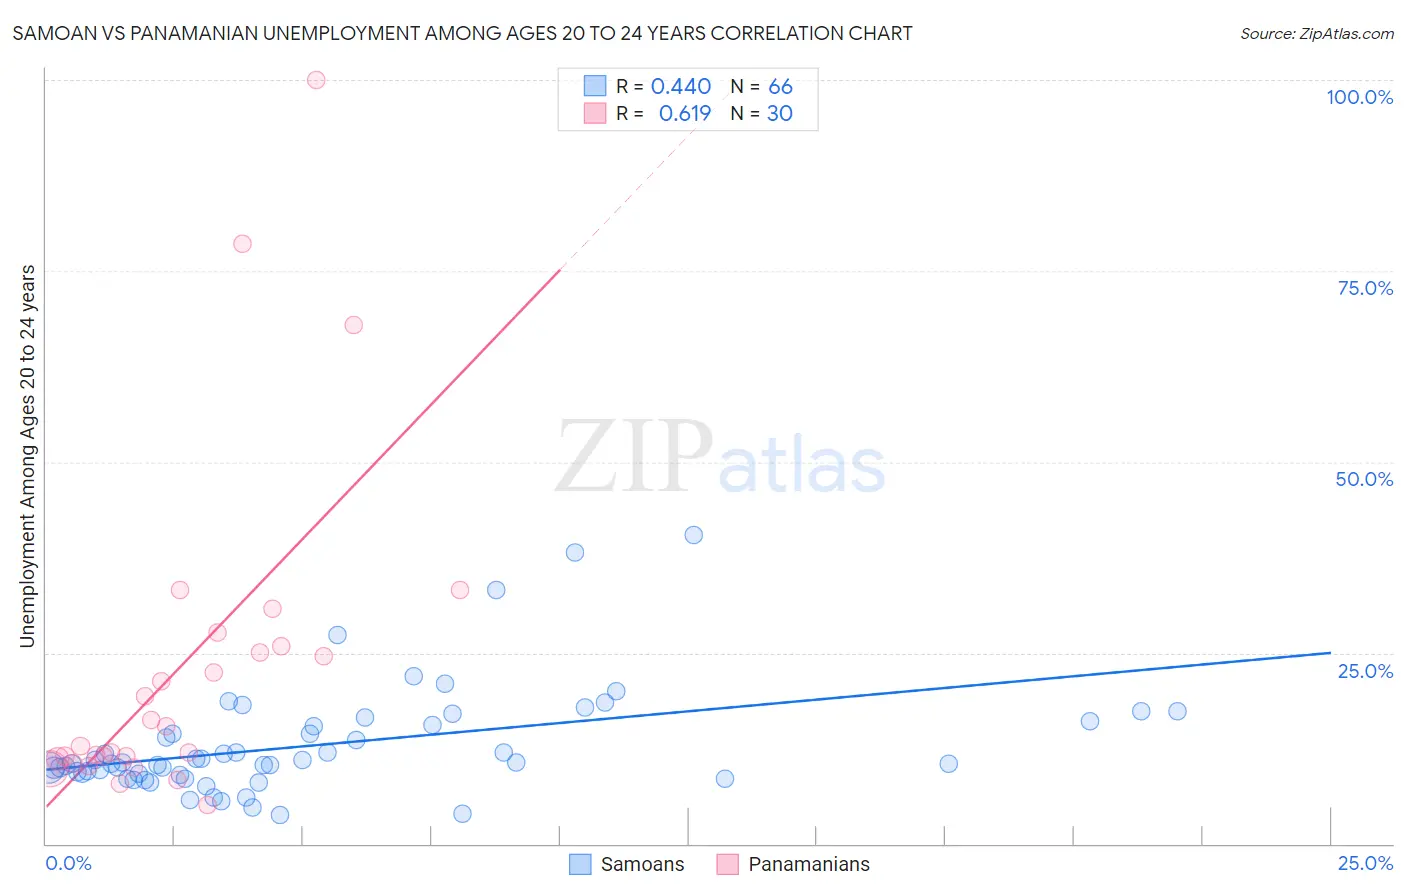
Samoan vs Panamanian Unemployment Among Ages 20 to 24 years Correlation Chart

The statistical analysis conducted on geographies consisting of 221,635,604 people shows a moderate positive correlation between the proportion of Samoans and unemployment rate among population between the ages 20 and 24 in the United States with a correlation coefficient (R) of 0.440 and weighted average of 10.3%. Similarly, the statistical analysis conducted on geographies consisting of 276,503,121 people shows a significant positive correlation between the proportion of Panamanians and unemployment rate among population between the ages 20 and 24 in the United States with a correlation coefficient (R) of 0.619 and weighted average of 10.9%, a difference of 5.4%.
Samoan vs Panamanian Unemployment Among Ages 20 to 24 years

Unemployment Among Ages 20 to 24 years Correlation Summary

MeasurementSamoanPanamanian
Minimum3.8%5.1%
Maximum40.4%100.0%
Range36.6%94.9%
Mean12.9%23.2%
Median10.6%14.1%
Interquartile 25% (IQ1)9.2%11.1%
Interquartile 75% (IQ3)15.5%25.9%
Interquartile Range (IQR)6.3%14.8%
Standard Deviation (Sample)7.0%21.9%
Standard Deviation (Population)7.0%21.5%

Similar Demographics by Unemployment Among Ages 20 to 24 years

Demographics Similar to Samoans by Unemployment Among Ages 20 to 24 years

In terms of unemployment among ages 20 to 24 years, the demographic groups most similar to Samoans are Potawatomi (10.3%, a difference of 0.13%), Ukrainian (10.3%, a difference of 0.17%), Immigrants from Czechoslovakia (10.3%, a difference of 0.17%), Alsatian (10.3%, a difference of 0.19%), and Immigrants from Sweden (10.3%, a difference of 0.20%).
DemographicsRating | RankUnemployment Among Ages 20 to 24 years
Iraqis
56.7
/100
|
#168
Average
10.3%
Immigrants | Colombia
56.3
/100
|
#169
Average
10.3%
Turks
55.2
/100
|
#170
Average
10.3%
Immigrants | Eastern Asia
52.7
/100
|
#171
Average
10.3%
Koreans
51.9
/100
|
#172
Average
10.3%
Immigrants | Sweden
50.8
/100
|
#173
Average
10.3%
Ukrainians
50.0
/100
|
#174
Average
10.3%
Samoans
45.4
/100
|
#175
Average
10.3%
Potawatomi
42.0
/100
|
#176
Average
10.3%
Immigrants | Czechoslovakia
40.8
/100
|
#177
Average
10.3%
Alsatians
40.5
/100
|
#178
Average
10.3%
Tlingit-Haida
39.7
/100
|
#179
Fair
10.3%
Immigrants | Turkey
39.3
/100
|
#180
Fair
10.3%
Okinawans
39.1
/100
|
#181
Fair
10.3%
Immigrants | Germany
38.1
/100
|
#182
Fair
10.4%

Demographics Similar to Panamanians by Unemployment Among Ages 20 to 24 years

In terms of unemployment among ages 20 to 24 years, the demographic groups most similar to Panamanians are Immigrants from Lebanon (10.9%, a difference of 0.030%), Dutch West Indian (10.9%, a difference of 0.10%), Immigrants from Western Asia (10.9%, a difference of 0.17%), Immigrants from Bahamas (10.9%, a difference of 0.24%), and Puget Sound Salish (10.9%, a difference of 0.27%).
DemographicsRating | RankUnemployment Among Ages 20 to 24 years
Immigrants | Syria
0.4
/100
|
#252
Tragic
10.8%
Spanish Americans
0.4
/100
|
#253
Tragic
10.8%
Liberians
0.3
/100
|
#254
Tragic
10.8%
Immigrants | Israel
0.3
/100
|
#255
Tragic
10.8%
Immigrants | Bahamas
0.3
/100
|
#256
Tragic
10.9%
Immigrants | Western Asia
0.3
/100
|
#257
Tragic
10.9%
Dutch West Indians
0.3
/100
|
#258
Tragic
10.9%
Panamanians
0.2
/100
|
#259
Tragic
10.9%
Immigrants | Lebanon
0.2
/100
|
#260
Tragic
10.9%
Puget Sound Salish
0.2
/100
|
#261
Tragic
10.9%
Immigrants | Latin America
0.1
/100
|
#262
Tragic
11.0%
Marshallese
0.1
/100
|
#263
Tragic
11.0%
Sub-Saharan Africans
0.0
/100
|
#264
Tragic
11.1%
Immigrants | Ireland
0.0
/100
|
#265
Tragic
11.1%
Immigrants | Liberia
0.0
/100
|
#266
Tragic
11.1%