Samoan vs Moroccan Unemployment Among Ages 25 to 29 years

COMPARE

Samoan
Race
Ancestry
AfghanAfricanAlaska NativeAlaskan AthabascanAlbanianAleutAlsatianAmericanApacheArabArapahoArgentineanArmenianAssyrian/Chaldean/SyriacAustralianAustrianBahamianBangladeshiBarbadianBasqueBelgianBelizeanBermudanBhutaneseBlackfeetBolivianBrazilianBritishBritish West IndianBulgarianBurmeseCajunCambodianCanadianCape VerdeanCarpatho RusynCelticCentral AmericanCentral American IndianCherokeeCheyenneChickasawChileanChineseChippewaChoctawColombianColvilleComancheCosta RicanCreeCreekCroatianCrowCubanCypriotCzechCzechoslovakianDanishDelawareDominicanDutchDutch West IndianEastern EuropeanEcuadorianEgyptianEnglishEstonianEthiopianEuropeanFijianFilipinoFinnishFrenchFrench American IndianFrench CanadianGermanGerman RussianGhanaianGreekGuamanian/ChamorroGuatemalanGuyaneseHaitianHmongHonduranHopiHoumaHungarianIcelanderIndian (Asian)IndonesianInupiatIranianIraqiIrishIroquoisIsraeliItalianJamaicanJapaneseJordanianKenyanKiowaKoreanLaotianLatvianLebaneseLiberianLithuanianLumbeeLuxembourgerMacedonianMalaysianMalteseMarshalleseMenomineeMexicanMexican American IndianMongolianNative HawaiianNavajoNepaleseNew ZealanderNicaraguanNigerianNorthern EuropeanNorwegianOkinawanOsageOttawaPaiutePakistaniPalestinianPanamanianParaguayanPennsylvania GermanPeruvianPimaPolishPortuguesePotawatomiPuebloPuerto RicanPuget Sound SalishRomanianRussianSalvadoranSamoanScandinavianScotch-IrishScottishSeminoleSenegaleseSerbianShoshoneSierra LeoneanSiouxSlavicSlovakSloveneSomaliSouth AfricanSouth AmericanSouth American IndianSoviet UnionSpaniardSpanishSpanish AmericanSpanish American IndianSri LankanSubsaharan AfricanSudaneseSwedishSwissSyrianTaiwaneseThaiTlingit-HaidaTohono O'OdhamTonganTrinidadian and TobagonianTsimshianTurkishU.S. Virgin IslanderUgandanUkrainianUruguayanUteVenezuelanVietnameseWelshWest IndianYakamaYaquiYugoslavianYumanYup'ikZimbabwean
Immigration
NonimmigrantsImmigrantsAfghanistanAfricaAlbaniaArgentinaArmeniaAsiaAustraliaAustriaBahamasBangladeshBarbadosBelarusBelgiumBelizeBoliviaBosnia and HerzegovinaBrazilBulgariaBurma/MyanmarCabo VerdeCambodiaCameroonCanadaCaribbeanCentral AmericaChileChinaColombiaCongoCosta RicaCroatiaCubaCzechoslovakiaDenmarkDominicaDominican RepublicEastern AfricaEastern AsiaEastern EuropeEcuadorEgyptEl SalvadorEnglandEritreaEthiopiaEuropeFijiFranceGermanyGhanaGreeceGrenadaGuatemalaGuyanaHaitiHondurasHong KongHungaryIndiaIndonesiaIranIraqIrelandIsraelItalyJamaicaJapanJordanKazakhstanKenyaKoreaKuwaitLaosLatin AmericaLatviaLebanonLiberiaLithuaniaMalaysiaMexicoMicronesiaMiddle AfricaMoldovaMoroccoNepalNetherlandsNicaraguaNigeriaNorth AmericaNorth MacedoniaNorthern AfricaNorthern EuropeNorwayOceaniaPakistanPanamaPeruPhilippinesPolandPortugalRomaniaRussiaSaudi ArabiaScotlandSenegalSerbiaSierra LeoneSingaporeSomaliaSouth AfricaSouth AmericaSouth Central AsiaSouth Eastern AsiaSouthern EuropeSpainSri LankaSt. Vincent and the GrenadinesSudanSwedenSwitzerlandSyriaTaiwanThailandTrinidad and TobagoTurkeyUgandaUkraineUruguayUzbekistanVenezuelaVietnamWest IndiesWestern AfricaWestern AsiaWestern EuropeYemenZaireZimbabweAzores
Moroccan
Race
Ancestry
AfghanAfricanAlaska NativeAlaskan AthabascanAlbanianAleutAlsatianAmericanApacheArabArapahoArgentineanArmenianAssyrian/Chaldean/SyriacAustralianAustrianBahamianBangladeshiBarbadianBasqueBelgianBelizeanBermudanBhutaneseBlackfeetBolivianBrazilianBritishBritish West IndianBulgarianBurmeseCajunCambodianCanadianCape VerdeanCarpatho RusynCelticCentral AmericanCentral American IndianCherokeeCheyenneChickasawChileanChineseChippewaChoctawColombianColvilleComancheCosta RicanCreeCreekCroatianCrowCubanCypriotCzechCzechoslovakianDanishDelawareDominicanDutchDutch West IndianEastern EuropeanEcuadorianEgyptianEnglishEstonianEthiopianEuropeanFijianFilipinoFinnishFrenchFrench American IndianFrench CanadianGermanGerman RussianGhanaianGreekGuamanian/ChamorroGuatemalanGuyaneseHaitianHmongHonduranHopiHoumaHungarianIcelanderIndian (Asian)IndonesianInupiatIranianIraqiIrishIroquoisIsraeliItalianJamaicanJapaneseJordanianKenyanKiowaKoreanLaotianLatvianLebaneseLiberianLithuanianLumbeeLuxembourgerMacedonianMalaysianMalteseMarshalleseMenomineeMexicanMexican American IndianMongolianMoroccanNative HawaiianNavajoNepaleseNew ZealanderNicaraguanNigerianNorthern EuropeanNorwegianOkinawanOsageOttawaPaiutePakistaniPalestinianPanamanianParaguayanPennsylvania GermanPeruvianPimaPolishPortuguesePotawatomiPuebloPuerto RicanPuget Sound SalishRomanianRussianSalvadoranScandinavianScotch-IrishScottishSeminoleSenegaleseSerbianShoshoneSierra LeoneanSiouxSlavicSlovakSloveneSomaliSouth AfricanSouth AmericanSouth American IndianSoviet UnionSpaniardSpanishSpanish AmericanSpanish American IndianSri LankanSubsaharan AfricanSudaneseSwedishSwissSyrianTaiwaneseThaiTlingit-HaidaTohono O'OdhamTonganTrinidadian and TobagonianTsimshianTurkishU.S. Virgin IslanderUgandanUkrainianUruguayanUteVenezuelanVietnameseWelshWest IndianYakamaYaquiYugoslavianYumanYup'ikZimbabwean
Immigration
NonimmigrantsImmigrantsAfghanistanAfricaAlbaniaArgentinaArmeniaAsiaAustraliaAustriaBahamasBangladeshBarbadosBelarusBelgiumBelizeBoliviaBosnia and HerzegovinaBrazilBulgariaBurma/MyanmarCabo VerdeCambodiaCameroonCanadaCaribbeanCentral AmericaChileChinaColombiaCongoCosta RicaCroatiaCubaCzechoslovakiaDenmarkDominicaDominican RepublicEastern AfricaEastern AsiaEastern EuropeEcuadorEgyptEl SalvadorEnglandEritreaEthiopiaEuropeFijiFranceGermanyGhanaGreeceGrenadaGuatemalaGuyanaHaitiHondurasHong KongHungaryIndiaIndonesiaIranIraqIrelandIsraelItalyJamaicaJapanJordanKazakhstanKenyaKoreaKuwaitLaosLatin AmericaLatviaLebanonLiberiaLithuaniaMalaysiaMexicoMicronesiaMiddle AfricaMoldovaMoroccoNepalNetherlandsNicaraguaNigeriaNorth AmericaNorth MacedoniaNorthern AfricaNorthern EuropeNorwayOceaniaPakistanPanamaPeruPhilippinesPolandPortugalRomaniaRussiaSaudi ArabiaScotlandSenegalSerbiaSierra LeoneSingaporeSomaliaSouth AfricaSouth AmericaSouth Central AsiaSouth Eastern AsiaSouthern EuropeSpainSri LankaSt. Vincent and the GrenadinesSudanSwedenSwitzerlandSyriaTaiwanThailandTrinidad and TobagoTurkeyUgandaUkraineUruguayUzbekistanVenezuelaVietnamWest IndiesWestern AfricaWestern AsiaWestern EuropeYemenZaireZimbabweAzores
Unemployment Among Ages 25 to 29 years
Income
Poverty
Unemployment
Labor Participation
Family Structure
Vehicle Availability
Education Level
Disability

Unemployment Among Ages 25 to 29 years Comparison

Samoans

Moroccans

Good
Fair
6.6%
UNEMPLOYMENT AMONG AGES 25 TO 29 YEARS
64.6/ 100
METRIC RATING
152nd/ 347
METRIC RANK
6.7%
UNEMPLOYMENT AMONG AGES 25 TO 29 YEARS
35.9/ 100
METRIC RATING
185th/ 347
METRIC RANK

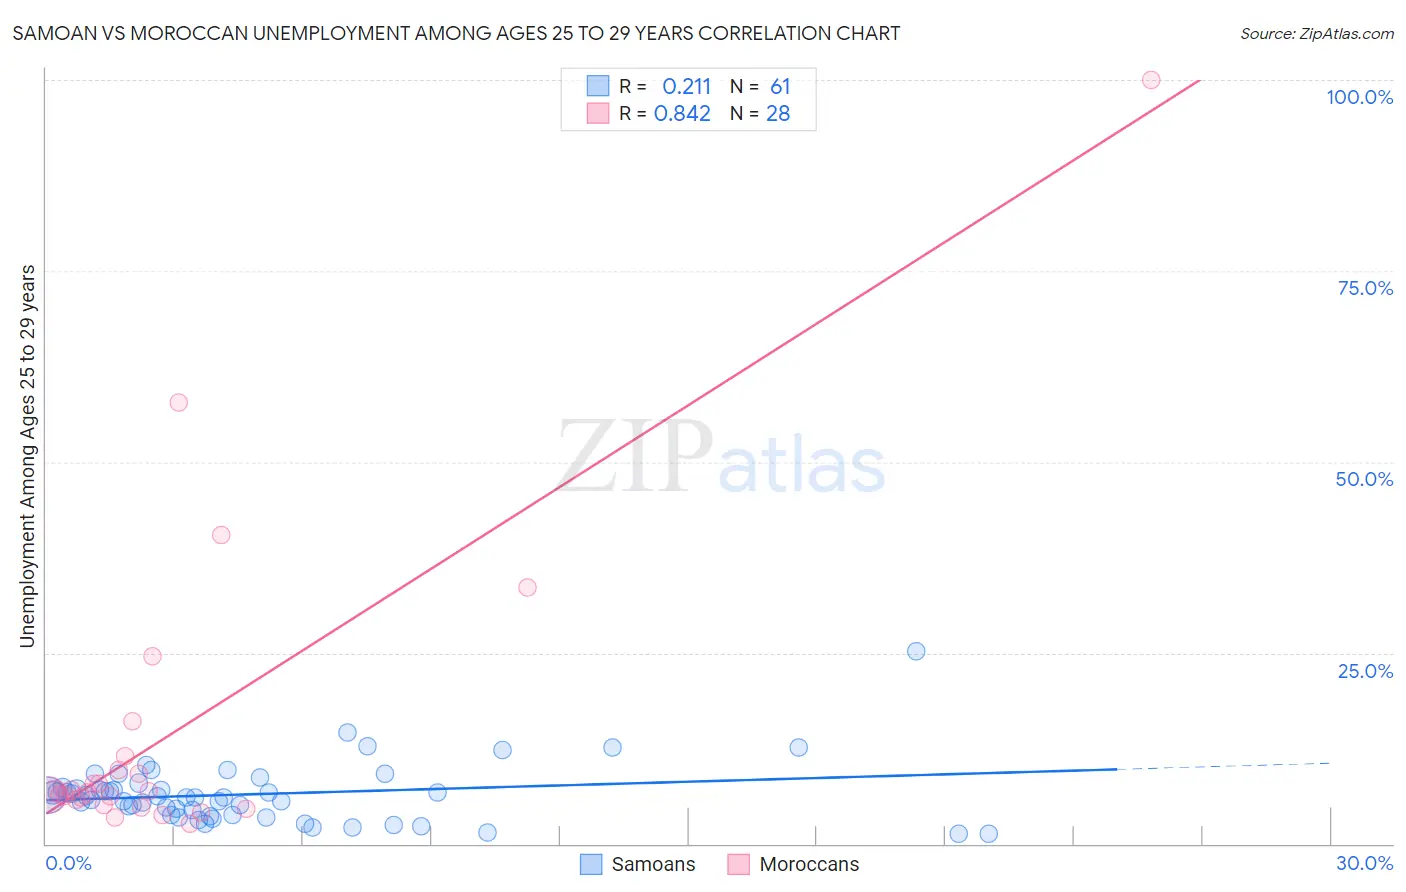
Samoan vs Moroccan Unemployment Among Ages 25 to 29 years Correlation Chart

The statistical analysis conducted on geographies consisting of 219,635,953 people shows a weak positive correlation between the proportion of Samoans and unemployment rate among population between the ages 25 and 29 in the United States with a correlation coefficient (R) of 0.211 and weighted average of 6.6%. Similarly, the statistical analysis conducted on geographies consisting of 198,257,019 people shows a very strong positive correlation between the proportion of Moroccans and unemployment rate among population between the ages 25 and 29 in the United States with a correlation coefficient (R) of 0.842 and weighted average of 6.7%, a difference of 1.8%.
Samoan vs Moroccan Unemployment Among Ages 25 to 29 years

Unemployment Among Ages 25 to 29 years Correlation Summary

MeasurementSamoanMoroccan
Minimum1.3%2.7%
Maximum25.2%100.0%
Range23.9%97.3%
Mean6.5%14.7%
Median6.1%6.8%
Interquartile 25% (IQ1)3.8%5.4%
Interquartile 75% (IQ3)7.3%10.5%
Interquartile Range (IQR)3.6%5.1%
Standard Deviation (Sample)3.9%21.0%
Standard Deviation (Population)3.8%20.6%

Similar Demographics by Unemployment Among Ages 25 to 29 years

Demographics Similar to Samoans by Unemployment Among Ages 25 to 29 years

In terms of unemployment among ages 25 to 29 years, the demographic groups most similar to Samoans are Immigrants from Italy (6.6%, a difference of 0.020%), Colombian (6.6%, a difference of 0.040%), Immigrants from Latvia (6.6%, a difference of 0.050%), Ukrainian (6.6%, a difference of 0.060%), and Immigrants from Laos (6.6%, a difference of 0.070%).
DemographicsRating | RankUnemployment Among Ages 25 to 29 years
Nicaraguans
70.2
/100
|
#145
Good
6.6%
Romanians
69.5
/100
|
#146
Good
6.6%
Immigrants | Thailand
68.4
/100
|
#147
Good
6.6%
Peruvians
68.1
/100
|
#148
Good
6.6%
Malaysians
67.1
/100
|
#149
Good
6.6%
Finns
66.9
/100
|
#150
Good
6.6%
Ukrainians
65.5
/100
|
#151
Good
6.6%
Samoans
64.6
/100
|
#152
Good
6.6%
Immigrants | Italy
64.4
/100
|
#153
Good
6.6%
Colombians
64.0
/100
|
#154
Good
6.6%
Immigrants | Latvia
63.9
/100
|
#155
Good
6.6%
Immigrants | Laos
63.5
/100
|
#156
Good
6.6%
South Africans
63.5
/100
|
#157
Good
6.6%
Immigrants | Russia
61.5
/100
|
#158
Good
6.6%
Welsh
61.3
/100
|
#159
Good
6.6%

Demographics Similar to Moroccans by Unemployment Among Ages 25 to 29 years

In terms of unemployment among ages 25 to 29 years, the demographic groups most similar to Moroccans are Immigrants from Iran (6.7%, a difference of 0.10%), Immigrants from Costa Rica (6.7%, a difference of 0.16%), Immigrants from South America (6.7%, a difference of 0.19%), Irish (6.7%, a difference of 0.21%), and Immigrants from Scotland (6.7%, a difference of 0.25%).
DemographicsRating | RankUnemployment Among Ages 25 to 29 years
Immigrants | Iraq
45.1
/100
|
#178
Average
6.7%
Costa Ricans
44.9
/100
|
#179
Average
6.7%
Immigrants | Africa
41.1
/100
|
#180
Average
6.7%
Immigrants | Western Europe
41.1
/100
|
#181
Average
6.7%
Czechoslovakians
40.7
/100
|
#182
Average
6.7%
Immigrants | Scotland
39.6
/100
|
#183
Fair
6.7%
Immigrants | Costa Rica
38.3
/100
|
#184
Fair
6.7%
Moroccans
35.9
/100
|
#185
Fair
6.7%
Immigrants | Iran
34.4
/100
|
#186
Fair
6.7%
Immigrants | South America
33.0
/100
|
#187
Fair
6.7%
Irish
32.8
/100
|
#188
Fair
6.7%
Argentineans
32.1
/100
|
#189
Fair
6.7%
Koreans
29.3
/100
|
#190
Fair
6.7%
Chickasaw
28.7
/100
|
#191
Fair
6.7%
Immigrants | Ukraine
28.6
/100
|
#192
Fair
6.7%