Samoan vs Immigrants from Netherlands Female Unemployment
COMPARE
Samoan
Immigrants from Netherlands
Female Unemployment
Female Unemployment Comparison
Samoans
Immigrants from Netherlands
5.4%
FEMALE UNEMPLOYMENT
10.6/ 100
METRIC RATING
213th/ 347
METRIC RANK
5.0%
FEMALE UNEMPLOYMENT
97.8/ 100
METRIC RATING
78th/ 347
METRIC RANK
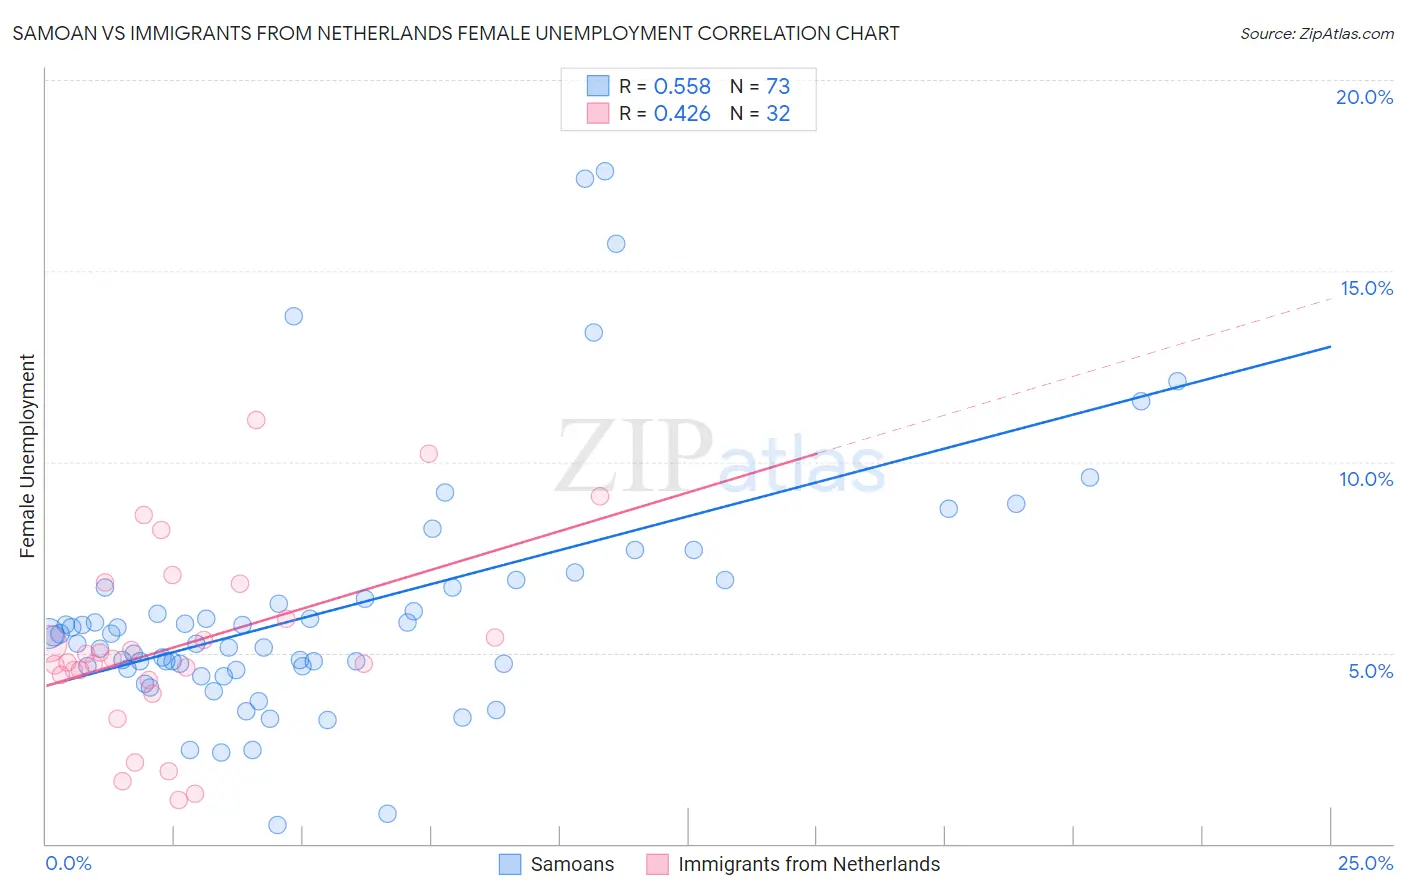
Samoan vs Immigrants from Netherlands Female Unemployment Correlation Chart
The statistical analysis conducted on geographies consisting of 224,572,142 people shows a substantial positive correlation between the proportion of Samoans and unemploymnet rate among females in the United States with a correlation coefficient (R) of 0.558 and weighted average of 5.4%. Similarly, the statistical analysis conducted on geographies consisting of 237,125,714 people shows a moderate positive correlation between the proportion of Immigrants from Netherlands and unemploymnet rate among females in the United States with a correlation coefficient (R) of 0.426 and weighted average of 5.0%, a difference of 9.5%.
Female Unemployment Correlation Summary
| Measurement | Samoan | Immigrants from Netherlands |
| Minimum | 0.50% | 1.2% |
| Maximum | 17.6% | 11.1% |
| Range | 17.1% | 9.9% |
| Mean | 6.1% | 5.2% |
| Median | 5.4% | 4.8% |
| Interquartile 25% (IQ1) | 4.6% | 4.4% |
| Interquartile 75% (IQ3) | 6.7% | 6.4% |
| Interquartile Range (IQR) | 2.1% | 2.0% |
| Standard Deviation (Sample) | 3.3% | 2.4% |
| Standard Deviation (Population) | 3.3% | 2.4% |
Similar Demographics by Female Unemployment
Demographics Similar to Samoans by Female Unemployment
In terms of female unemployment, the demographic groups most similar to Samoans are Seminole (5.4%, a difference of 0.050%), Immigrants from Nicaragua (5.4%, a difference of 0.070%), Comanche (5.4%, a difference of 0.090%), Uruguayan (5.4%, a difference of 0.12%), and Ottawa (5.4%, a difference of 0.14%).
| Demographics | Rating | Rank | Female Unemployment |
| Immigrants | Brazil | 18.8 /100 | #206 | Poor 5.4% |
| Creek | 15.4 /100 | #207 | Poor 5.4% |
| Immigrants | Costa Rica | 13.7 /100 | #208 | Poor 5.4% |
| Koreans | 13.4 /100 | #209 | Poor 5.4% |
| Choctaw | 12.3 /100 | #210 | Poor 5.4% |
| Ottawa | 11.6 /100 | #211 | Poor 5.4% |
| Uruguayans | 11.4 /100 | #212 | Poor 5.4% |
| Samoans | 10.6 /100 | #213 | Poor 5.4% |
| Seminole | 10.3 /100 | #214 | Poor 5.4% |
| Immigrants | Nicaragua | 10.2 /100 | #215 | Poor 5.4% |
| Comanche | 10.0 /100 | #216 | Poor 5.4% |
| Peruvians | 9.6 /100 | #217 | Tragic 5.4% |
| Bermudans | 9.0 /100 | #218 | Tragic 5.4% |
| South Americans | 8.6 /100 | #219 | Tragic 5.4% |
| Immigrants | Africa | 8.5 /100 | #220 | Tragic 5.4% |
Demographics Similar to Immigrants from Netherlands by Female Unemployment
In terms of female unemployment, the demographic groups most similar to Immigrants from Netherlands are Mongolian (5.0%, a difference of 0.0%), Immigrants from Venezuela (5.0%, a difference of 0.090%), Immigrants from Singapore (5.0%, a difference of 0.10%), Immigrants from Bolivia (5.0%, a difference of 0.12%), and Russian (5.0%, a difference of 0.13%).
| Demographics | Rating | Rank | Female Unemployment |
| German Russians | 98.1 /100 | #71 | Exceptional 4.9% |
| Immigrants | Northern Europe | 98.0 /100 | #72 | Exceptional 4.9% |
| Russians | 98.0 /100 | #73 | Exceptional 5.0% |
| Immigrants | Bolivia | 98.0 /100 | #74 | Exceptional 5.0% |
| Immigrants | Singapore | 98.0 /100 | #75 | Exceptional 5.0% |
| Immigrants | Venezuela | 97.9 /100 | #76 | Exceptional 5.0% |
| Mongolians | 97.8 /100 | #77 | Exceptional 5.0% |
| Immigrants | Netherlands | 97.8 /100 | #78 | Exceptional 5.0% |
| Turks | 97.6 /100 | #79 | Exceptional 5.0% |
| New Zealanders | 97.4 /100 | #80 | Exceptional 5.0% |
| Filipinos | 97.3 /100 | #81 | Exceptional 5.0% |
| Immigrants | Australia | 97.3 /100 | #82 | Exceptional 5.0% |
| Immigrants | Serbia | 97.2 /100 | #83 | Exceptional 5.0% |
| Canadians | 97.2 /100 | #84 | Exceptional 5.0% |
| Ukrainians | 97.1 /100 | #85 | Exceptional 5.0% |