Samoan vs Dutch West Indian Unemployment Among Youth under 25 years
COMPARE
Samoan
Dutch West Indian
Unemployment Among Youth under 25 years
Unemployment Among Youth under 25 years Comparison
Samoans
Dutch West Indians
11.9%
UNEMPLOYMENT AMONG YOUTH UNDER 25 YEARS
7.4/ 100
METRIC RATING
215th/ 347
METRIC RANK
12.1%
UNEMPLOYMENT AMONG YOUTH UNDER 25 YEARS
1.1/ 100
METRIC RATING
240th/ 347
METRIC RANK
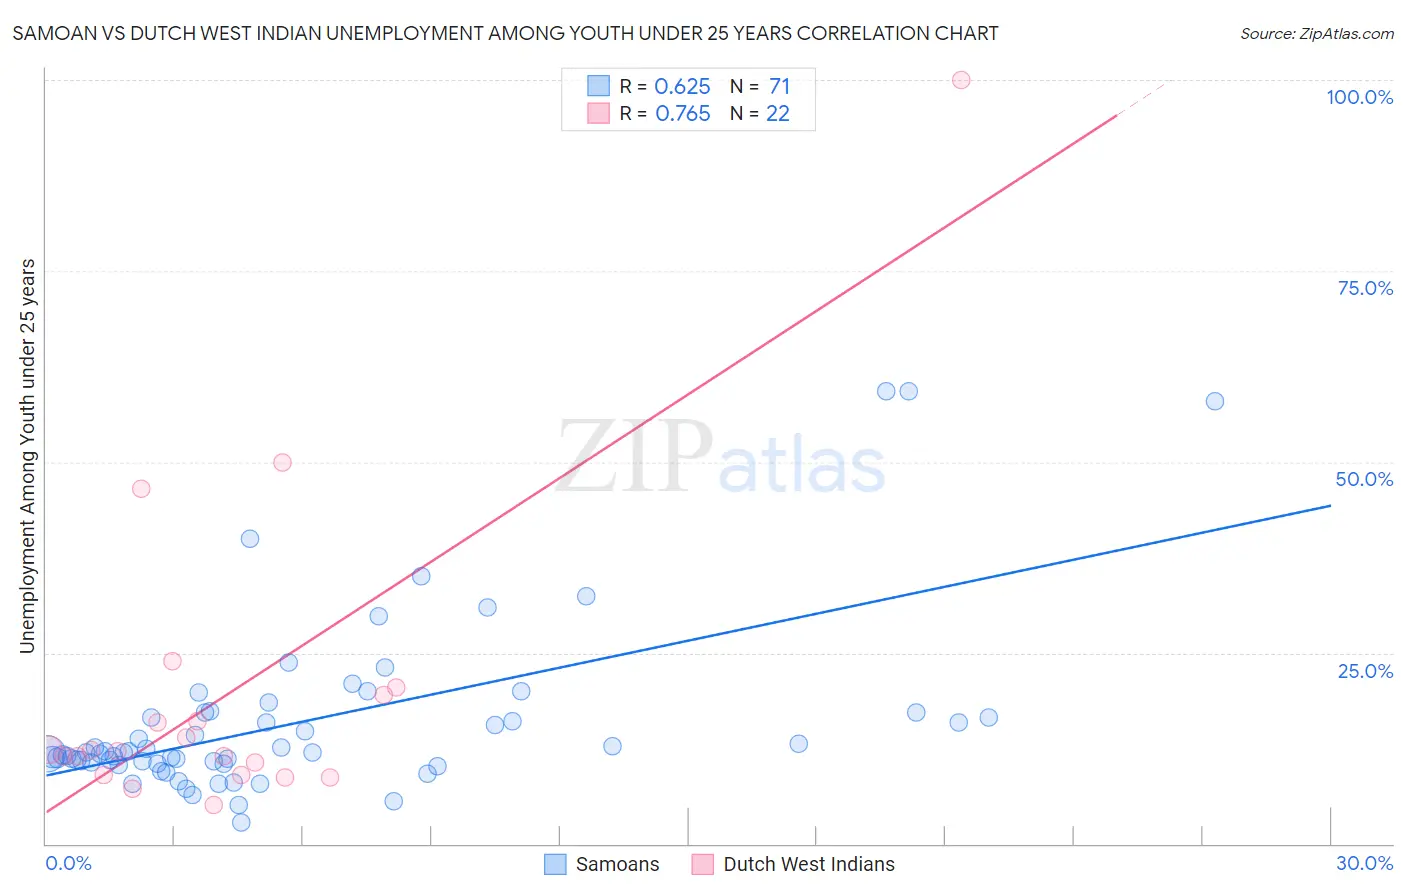
Samoan vs Dutch West Indian Unemployment Among Youth under 25 years Correlation Chart
The statistical analysis conducted on geographies consisting of 223,724,498 people shows a significant positive correlation between the proportion of Samoans and unemployment rate among youth under the age of 25 in the United States with a correlation coefficient (R) of 0.625 and weighted average of 11.9%. Similarly, the statistical analysis conducted on geographies consisting of 85,012,533 people shows a strong positive correlation between the proportion of Dutch West Indians and unemployment rate among youth under the age of 25 in the United States with a correlation coefficient (R) of 0.765 and weighted average of 12.1%, a difference of 2.0%.
Unemployment Among Youth under 25 years Correlation Summary
| Measurement | Samoan | Dutch West Indian |
| Minimum | 2.8% | 5.1% |
| Maximum | 59.3% | 100.0% |
| Range | 56.5% | 94.9% |
| Mean | 15.9% | 19.8% |
| Median | 12.0% | 12.1% |
| Interquartile 25% (IQ1) | 10.7% | 9.1% |
| Interquartile 75% (IQ3) | 17.1% | 19.5% |
| Interquartile Range (IQR) | 6.5% | 10.4% |
| Standard Deviation (Sample) | 11.4% | 21.2% |
| Standard Deviation (Population) | 11.3% | 20.7% |
Similar Demographics by Unemployment Among Youth under 25 years
Demographics Similar to Samoans by Unemployment Among Youth under 25 years
In terms of unemployment among youth under 25 years, the demographic groups most similar to Samoans are Guamanian/Chamorro (11.9%, a difference of 0.060%), Yaqui (11.9%, a difference of 0.070%), Immigrants from Middle Africa (11.9%, a difference of 0.080%), Costa Rican (11.9%, a difference of 0.11%), and South American (11.9%, a difference of 0.15%).
| Demographics | Rating | Rank | Unemployment Among Youth under 25 years |
| Comanche | 12.1 /100 | #208 | Poor 11.8% |
| Immigrants | Lebanon | 11.3 /100 | #209 | Poor 11.8% |
| Assyrians/Chaldeans/Syriacs | 9.8 /100 | #210 | Tragic 11.9% |
| Immigrants | Philippines | 9.2 /100 | #211 | Tragic 11.9% |
| Colombians | 9.1 /100 | #212 | Tragic 11.9% |
| South Americans | 8.5 /100 | #213 | Tragic 11.9% |
| Costa Ricans | 8.2 /100 | #214 | Tragic 11.9% |
| Samoans | 7.4 /100 | #215 | Tragic 11.9% |
| Guamanians/Chamorros | 7.0 /100 | #216 | Tragic 11.9% |
| Yaqui | 6.9 /100 | #217 | Tragic 11.9% |
| Immigrants | Middle Africa | 6.8 /100 | #218 | Tragic 11.9% |
| Immigrants | Nonimmigrants | 6.2 /100 | #219 | Tragic 11.9% |
| Alsatians | 6.1 /100 | #220 | Tragic 11.9% |
| Immigrants | Portugal | 4.9 /100 | #221 | Tragic 12.0% |
| Israelis | 4.1 /100 | #222 | Tragic 12.0% |
Demographics Similar to Dutch West Indians by Unemployment Among Youth under 25 years
In terms of unemployment among youth under 25 years, the demographic groups most similar to Dutch West Indians are Immigrants from Albania (12.1%, a difference of 0.020%), Immigrants from Africa (12.1%, a difference of 0.030%), Albanian (12.1%, a difference of 0.080%), Native Hawaiian (12.1%, a difference of 0.15%), and Immigrants (12.1%, a difference of 0.17%).
| Demographics | Rating | Rank | Unemployment Among Youth under 25 years |
| South American Indians | 1.6 /100 | #233 | Tragic 12.1% |
| Guatemalans | 1.4 /100 | #234 | Tragic 12.1% |
| Immigrants | Guatemala | 1.4 /100 | #235 | Tragic 12.1% |
| Immigrants | Immigrants | 1.3 /100 | #236 | Tragic 12.1% |
| Native Hawaiians | 1.3 /100 | #237 | Tragic 12.1% |
| Albanians | 1.2 /100 | #238 | Tragic 12.1% |
| Immigrants | Africa | 1.1 /100 | #239 | Tragic 12.1% |
| Dutch West Indians | 1.1 /100 | #240 | Tragic 12.1% |
| Immigrants | Albania | 1.1 /100 | #241 | Tragic 12.1% |
| Immigrants | Western Asia | 0.8 /100 | #242 | Tragic 12.2% |
| Immigrants | Azores | 0.6 /100 | #243 | Tragic 12.2% |
| Alaskan Athabascans | 0.6 /100 | #244 | Tragic 12.2% |
| Spanish Americans | 0.6 /100 | #245 | Tragic 12.2% |
| Immigrants | Honduras | 0.6 /100 | #246 | Tragic 12.2% |
| Immigrants | Greece | 0.6 /100 | #247 | Tragic 12.2% |