Russian vs Sierra Leonean Unemployment Among Women with Children Under 18 years
COMPARE
Russian
Sierra Leonean
Unemployment Among Women with Children Under 18 years
Unemployment Among Women with Children Under 18 years Comparison
Russians
Sierra Leoneans
5.1%
UNEMPLOYMENT AMONG WOMEN WITH CHILDREN UNDER 18 YEARS
97.5/ 100
METRIC RATING
61st/ 347
METRIC RANK
5.8%
UNEMPLOYMENT AMONG WOMEN WITH CHILDREN UNDER 18 YEARS
3.8/ 100
METRIC RATING
227th/ 347
METRIC RANK
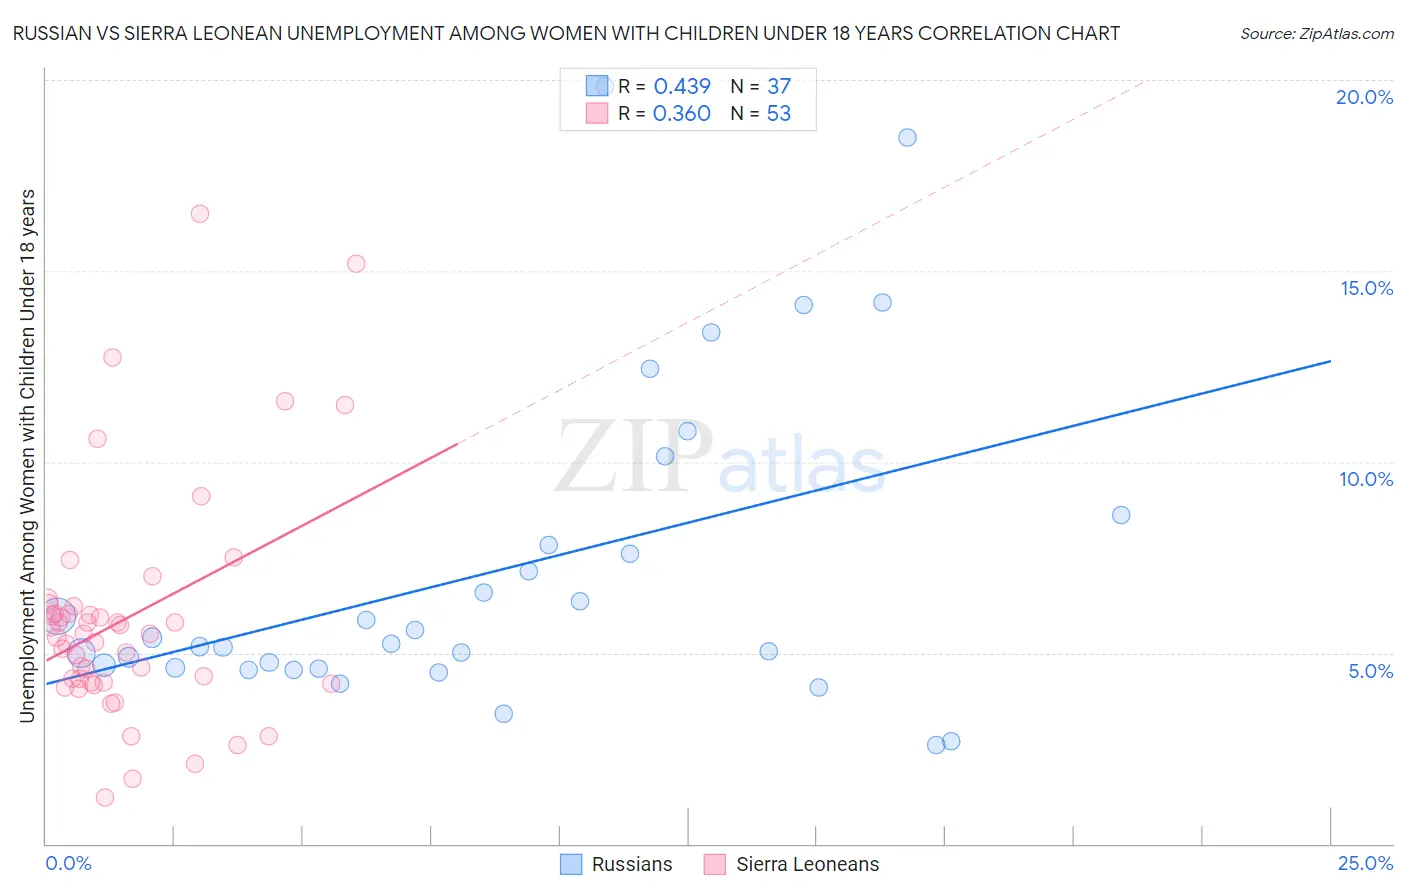
Russian vs Sierra Leonean Unemployment Among Women with Children Under 18 years Correlation Chart
The statistical analysis conducted on geographies consisting of 475,239,030 people shows a moderate positive correlation between the proportion of Russians and unemployment rate among women with children under the age of 18 in the United States with a correlation coefficient (R) of 0.439 and weighted average of 5.1%. Similarly, the statistical analysis conducted on geographies consisting of 82,735,837 people shows a mild positive correlation between the proportion of Sierra Leoneans and unemployment rate among women with children under the age of 18 in the United States with a correlation coefficient (R) of 0.360 and weighted average of 5.8%, a difference of 13.1%.
Unemployment Among Women with Children Under 18 years Correlation Summary
| Measurement | Russian | Sierra Leonean |
| Minimum | 2.6% | 1.2% |
| Maximum | 19.8% | 16.5% |
| Range | 17.2% | 15.3% |
| Mean | 7.2% | 5.9% |
| Median | 5.2% | 5.5% |
| Interquartile 25% (IQ1) | 4.6% | 4.2% |
| Interquartile 75% (IQ3) | 8.2% | 6.1% |
| Interquartile Range (IQR) | 3.6% | 1.9% |
| Standard Deviation (Sample) | 4.2% | 3.0% |
| Standard Deviation (Population) | 4.2% | 3.0% |
Similar Demographics by Unemployment Among Women with Children Under 18 years
Demographics Similar to Russians by Unemployment Among Women with Children Under 18 years
In terms of unemployment among women with children under 18 years, the demographic groups most similar to Russians are Immigrants from Bulgaria (5.1%, a difference of 0.070%), Italian (5.1%, a difference of 0.080%), Welsh (5.1%, a difference of 0.15%), Estonian (5.1%, a difference of 0.26%), and Immigrants from Sweden (5.1%, a difference of 0.28%).
| Demographics | Rating | Rank | Unemployment Among Women with Children Under 18 years |
| Immigrants | Serbia | 98.2 /100 | #54 | Exceptional 5.1% |
| Immigrants | Sri Lanka | 98.1 /100 | #55 | Exceptional 5.1% |
| Immigrants | Ireland | 98.0 /100 | #56 | Exceptional 5.1% |
| Czechoslovakians | 98.0 /100 | #57 | Exceptional 5.1% |
| Immigrants | Belgium | 97.9 /100 | #58 | Exceptional 5.1% |
| Asians | 97.9 /100 | #59 | Exceptional 5.1% |
| Welsh | 97.7 /100 | #60 | Exceptional 5.1% |
| Russians | 97.5 /100 | #61 | Exceptional 5.1% |
| Immigrants | Bulgaria | 97.4 /100 | #62 | Exceptional 5.1% |
| Italians | 97.4 /100 | #63 | Exceptional 5.1% |
| Estonians | 97.2 /100 | #64 | Exceptional 5.1% |
| Immigrants | Sweden | 97.1 /100 | #65 | Exceptional 5.1% |
| Immigrants | Australia | 97.0 /100 | #66 | Exceptional 5.1% |
| Fijians | 96.9 /100 | #67 | Exceptional 5.1% |
| Irish | 96.8 /100 | #68 | Exceptional 5.1% |
Demographics Similar to Sierra Leoneans by Unemployment Among Women with Children Under 18 years
In terms of unemployment among women with children under 18 years, the demographic groups most similar to Sierra Leoneans are Somali (5.8%, a difference of 0.14%), Cherokee (5.7%, a difference of 0.20%), Immigrants from Panama (5.8%, a difference of 0.23%), Armenian (5.7%, a difference of 0.27%), and Immigrants from South America (5.8%, a difference of 0.29%).
| Demographics | Rating | Rank | Unemployment Among Women with Children Under 18 years |
| Immigrants | Fiji | 6.3 /100 | #220 | Tragic 5.7% |
| Pennsylvania Germans | 5.7 /100 | #221 | Tragic 5.7% |
| Osage | 5.0 /100 | #222 | Tragic 5.7% |
| Potawatomi | 5.0 /100 | #223 | Tragic 5.7% |
| Immigrants | Syria | 4.6 /100 | #224 | Tragic 5.7% |
| Armenians | 4.5 /100 | #225 | Tragic 5.7% |
| Cherokee | 4.3 /100 | #226 | Tragic 5.7% |
| Sierra Leoneans | 3.8 /100 | #227 | Tragic 5.8% |
| Somalis | 3.5 /100 | #228 | Tragic 5.8% |
| Immigrants | Panama | 3.4 /100 | #229 | Tragic 5.8% |
| Immigrants | South America | 3.2 /100 | #230 | Tragic 5.8% |
| Immigrants | Africa | 3.1 /100 | #231 | Tragic 5.8% |
| Creek | 3.1 /100 | #232 | Tragic 5.8% |
| Spanish Americans | 3.1 /100 | #233 | Tragic 5.8% |
| Guamanians/Chamorros | 2.9 /100 | #234 | Tragic 5.8% |