Puget Sound Salish vs Houma Male Unemployment
COMPARE
Puget Sound Salish
Houma
Male Unemployment
Male Unemployment Comparison
Puget Sound Salish
Houma
5.5%
MALE UNEMPLOYMENT
5.6/ 100
METRIC RATING
214th/ 347
METRIC RANK
7.1%
MALE UNEMPLOYMENT
0.0/ 100
METRIC RATING
315th/ 347
METRIC RANK
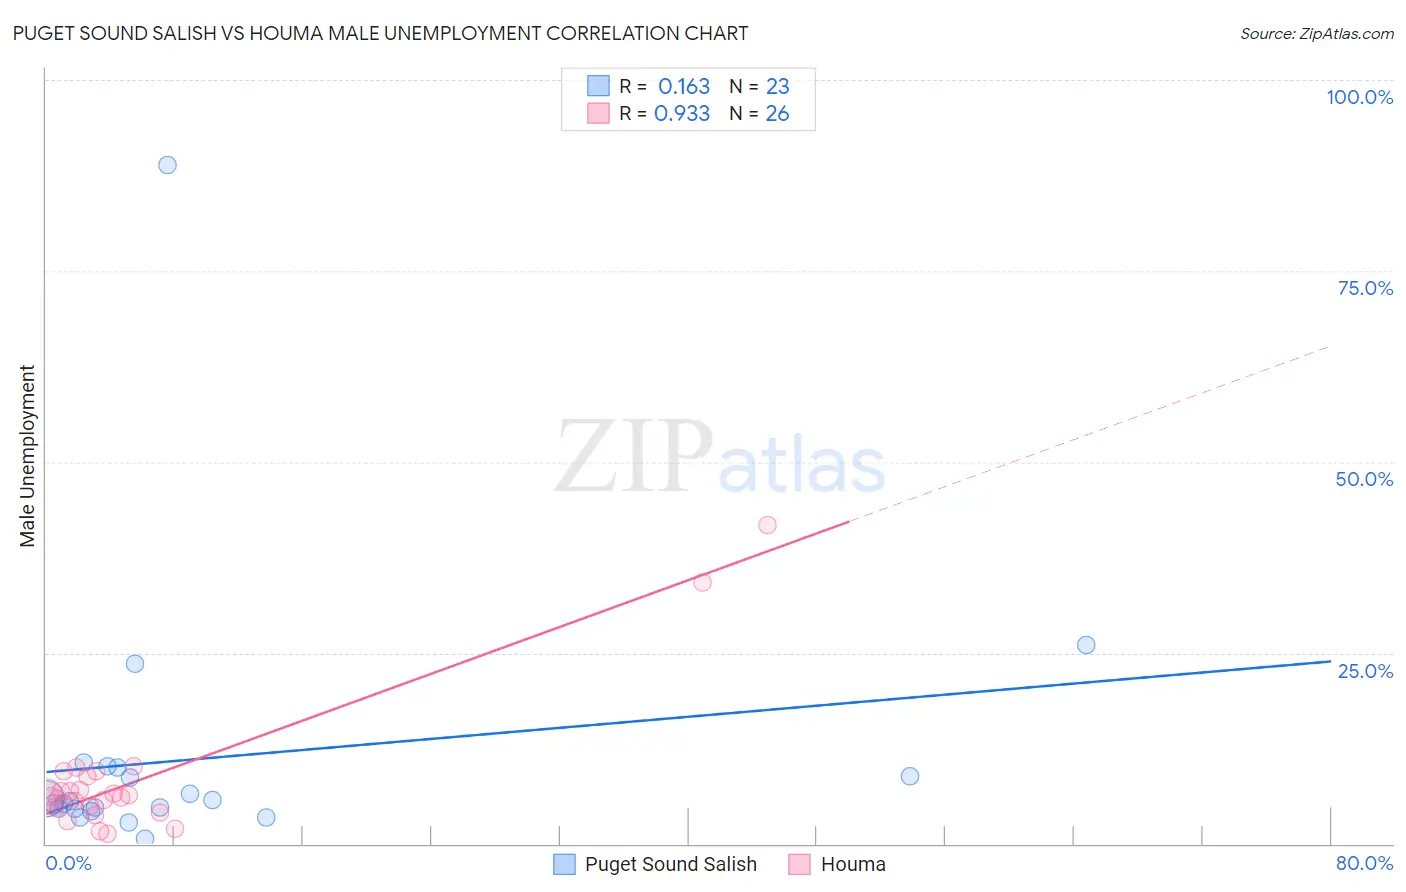
Puget Sound Salish vs Houma Male Unemployment Correlation Chart
The statistical analysis conducted on geographies consisting of 46,067,216 people shows a poor positive correlation between the proportion of Puget Sound Salish and unemployment rate among males in the United States with a correlation coefficient (R) of 0.163 and weighted average of 5.5%. Similarly, the statistical analysis conducted on geographies consisting of 36,684,970 people shows a near-perfect positive correlation between the proportion of Houma and unemployment rate among males in the United States with a correlation coefficient (R) of 0.933 and weighted average of 7.1%, a difference of 28.9%.
Male Unemployment Correlation Summary
| Measurement | Puget Sound Salish | Houma |
| Minimum | 0.60% | 1.2% |
| Maximum | 88.9% | 41.8% |
| Range | 88.3% | 40.6% |
| Mean | 11.1% | 8.4% |
| Median | 5.5% | 6.4% |
| Interquartile 25% (IQ1) | 4.6% | 4.8% |
| Interquartile 75% (IQ3) | 10.0% | 8.8% |
| Interquartile Range (IQR) | 5.4% | 4.0% |
| Standard Deviation (Sample) | 18.0% | 9.1% |
| Standard Deviation (Population) | 17.6% | 8.9% |
Similar Demographics by Male Unemployment
Demographics Similar to Puget Sound Salish by Male Unemployment
In terms of male unemployment, the demographic groups most similar to Puget Sound Salish are Ugandan (5.5%, a difference of 0.17%), Samoan (5.5%, a difference of 0.20%), Hmong (5.5%, a difference of 0.33%), Immigrants (5.5%, a difference of 0.37%), and Delaware (5.5%, a difference of 0.42%).
| Demographics | Rating | Rank | Male Unemployment |
| Immigrants | Syria | 9.3 /100 | #207 | Tragic 5.5% |
| Immigrants | Lebanon | 8.6 /100 | #208 | Tragic 5.5% |
| Immigrants | Middle Africa | 8.3 /100 | #209 | Tragic 5.5% |
| South American Indians | 7.6 /100 | #210 | Tragic 5.5% |
| Israelis | 7.4 /100 | #211 | Tragic 5.5% |
| Hmong | 7.0 /100 | #212 | Tragic 5.5% |
| Ugandans | 6.3 /100 | #213 | Tragic 5.5% |
| Puget Sound Salish | 5.6 /100 | #214 | Tragic 5.5% |
| Samoans | 4.9 /100 | #215 | Tragic 5.5% |
| Immigrants | Immigrants | 4.3 /100 | #216 | Tragic 5.5% |
| Delaware | 4.2 /100 | #217 | Tragic 5.5% |
| Immigrants | Albania | 3.6 /100 | #218 | Tragic 5.5% |
| Immigrants | Western Asia | 3.5 /100 | #219 | Tragic 5.6% |
| Portuguese | 3.5 /100 | #220 | Tragic 5.6% |
| Soviet Union | 3.2 /100 | #221 | Tragic 5.6% |
Demographics Similar to Houma by Male Unemployment
In terms of male unemployment, the demographic groups most similar to Houma are Immigrants from Guyana (7.1%, a difference of 0.030%), Guyanese (7.1%, a difference of 0.080%), Cape Verdean (7.1%, a difference of 0.15%), Immigrants from Barbados (7.1%, a difference of 0.21%), and Immigrants from Dominica (7.0%, a difference of 1.5%).
| Demographics | Rating | Rank | Male Unemployment |
| Aleuts | 0.0 /100 | #308 | Tragic 6.8% |
| Barbadians | 0.0 /100 | #309 | Tragic 6.9% |
| Blacks/African Americans | 0.0 /100 | #310 | Tragic 6.9% |
| Immigrants | Armenia | 0.0 /100 | #311 | Tragic 6.9% |
| Lumbee | 0.0 /100 | #312 | Tragic 6.9% |
| Immigrants | Dominica | 0.0 /100 | #313 | Tragic 7.0% |
| Immigrants | Barbados | 0.0 /100 | #314 | Tragic 7.1% |
| Houma | 0.0 /100 | #315 | Tragic 7.1% |
| Immigrants | Guyana | 0.0 /100 | #316 | Tragic 7.1% |
| Guyanese | 0.0 /100 | #317 | Tragic 7.1% |
| Cape Verdeans | 0.0 /100 | #318 | Tragic 7.1% |
| British West Indians | 0.0 /100 | #319 | Tragic 7.3% |
| Colville | 0.0 /100 | #320 | Tragic 7.4% |
| Immigrants | St. Vincent and the Grenadines | 0.0 /100 | #321 | Tragic 7.5% |
| Immigrants | Cabo Verde | 0.0 /100 | #322 | Tragic 7.5% |