Pueblo vs West Indian Unemployment
COMPARE
Pueblo
West Indian
Unemployment
Unemployment Comparison
Pueblo
West Indians
7.2%
UNEMPLOYMENT
0.0/ 100
METRIC RATING
327th/ 347
METRIC RANK
6.4%
UNEMPLOYMENT
0.0/ 100
METRIC RATING
302nd/ 347
METRIC RANK
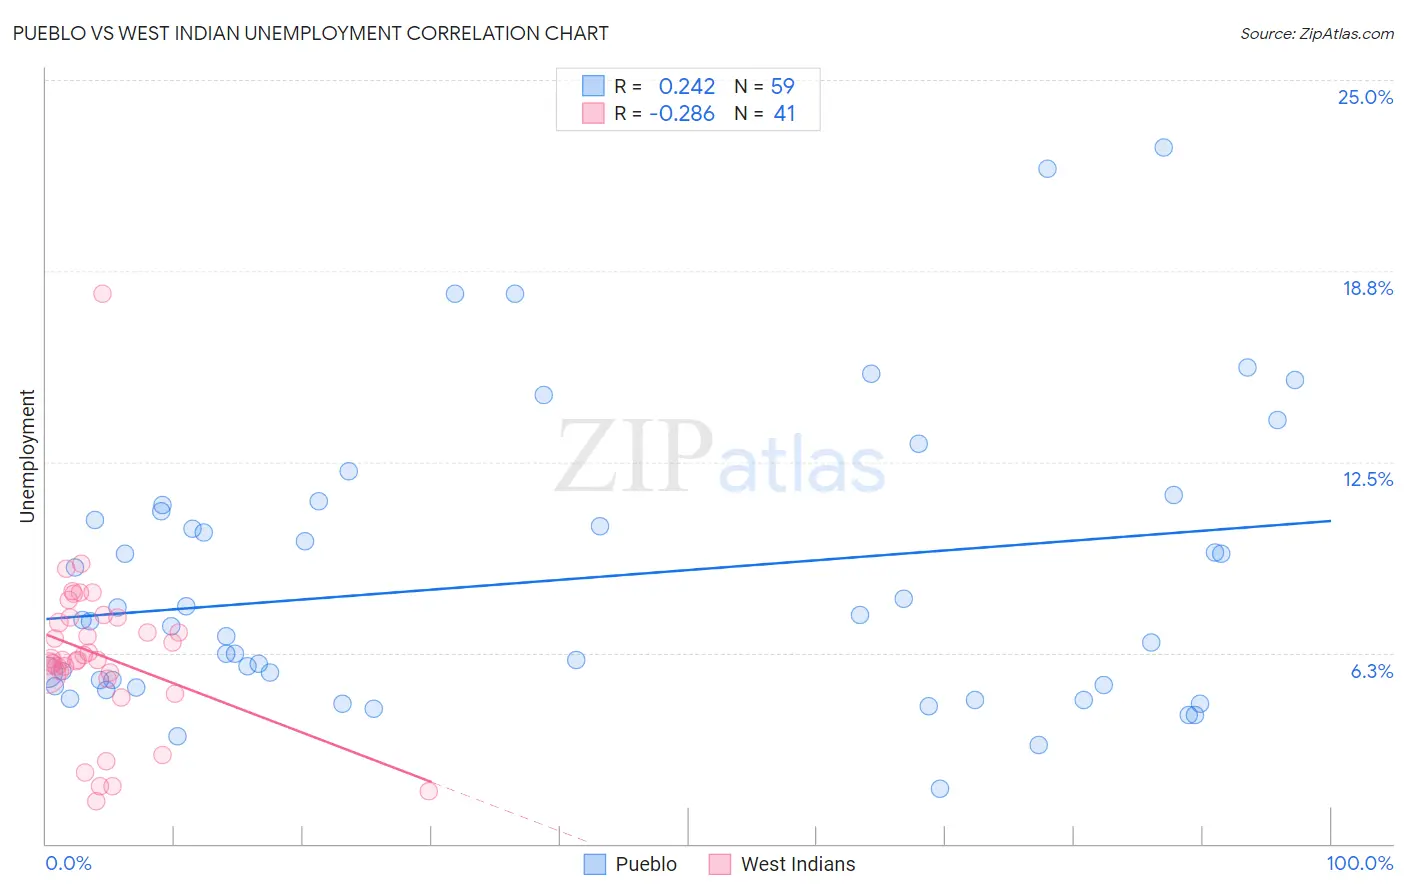
Pueblo vs West Indian Unemployment Correlation Chart
The statistical analysis conducted on geographies consisting of 120,042,060 people shows a weak positive correlation between the proportion of Pueblo and unemployment in the United States with a correlation coefficient (R) of 0.242 and weighted average of 7.2%. Similarly, the statistical analysis conducted on geographies consisting of 253,931,016 people shows a weak negative correlation between the proportion of West Indians and unemployment in the United States with a correlation coefficient (R) of -0.286 and weighted average of 6.4%, a difference of 12.4%.
Unemployment Correlation Summary
| Measurement | Pueblo | West Indian |
| Minimum | 1.8% | 1.4% |
| Maximum | 22.8% | 18.0% |
| Range | 21.0% | 16.6% |
| Mean | 8.6% | 6.2% |
| Median | 7.3% | 6.0% |
| Interquartile 25% (IQ1) | 5.2% | 5.5% |
| Interquartile 75% (IQ3) | 10.9% | 7.4% |
| Interquartile Range (IQR) | 5.7% | 1.9% |
| Standard Deviation (Sample) | 4.6% | 2.8% |
| Standard Deviation (Population) | 4.6% | 2.7% |
Similar Demographics by Unemployment
Demographics Similar to Pueblo by Unemployment
In terms of unemployment, the demographic groups most similar to Pueblo are Paiute (7.1%, a difference of 0.53%), Tsimshian (7.2%, a difference of 0.91%), Alaska Native (7.2%, a difference of 1.2%), Native/Alaskan (7.0%, a difference of 1.7%), and Immigrants from Armenia (7.0%, a difference of 2.3%).
| Demographics | Rating | Rank | Unemployment |
| Immigrants | St. Vincent and the Grenadines | 0.0 /100 | #320 | Tragic 6.9% |
| Immigrants | Guyana | 0.0 /100 | #321 | Tragic 6.9% |
| Guyanese | 0.0 /100 | #322 | Tragic 6.9% |
| Immigrants | Grenada | 0.0 /100 | #323 | Tragic 6.9% |
| Immigrants | Armenia | 0.0 /100 | #324 | Tragic 7.0% |
| Natives/Alaskans | 0.0 /100 | #325 | Tragic 7.0% |
| Paiute | 0.0 /100 | #326 | Tragic 7.1% |
| Pueblo | 0.0 /100 | #327 | Tragic 7.2% |
| Tsimshian | 0.0 /100 | #328 | Tragic 7.2% |
| Alaska Natives | 0.0 /100 | #329 | Tragic 7.2% |
| Yakama | 0.0 /100 | #330 | Tragic 7.3% |
| Dominicans | 0.0 /100 | #331 | Tragic 7.4% |
| Sioux | 0.0 /100 | #332 | Tragic 7.4% |
| Immigrants | Dominican Republic | 0.0 /100 | #333 | Tragic 7.4% |
| Apache | 0.0 /100 | #334 | Tragic 7.4% |
Demographics Similar to West Indians by Unemployment
In terms of unemployment, the demographic groups most similar to West Indians are Belizean (6.4%, a difference of 0.23%), Trinidadian and Tobagonian (6.3%, a difference of 0.25%), Immigrants from Trinidad and Tobago (6.3%, a difference of 0.74%), Immigrants from West Indies (6.3%, a difference of 0.86%), and Immigrants from Haiti (6.3%, a difference of 0.90%).
| Demographics | Rating | Rank | Unemployment |
| U.S. Virgin Islanders | 0.0 /100 | #295 | Tragic 6.3% |
| Ute | 0.0 /100 | #296 | Tragic 6.3% |
| Jamaicans | 0.0 /100 | #297 | Tragic 6.3% |
| Immigrants | Haiti | 0.0 /100 | #298 | Tragic 6.3% |
| Immigrants | West Indies | 0.0 /100 | #299 | Tragic 6.3% |
| Immigrants | Trinidad and Tobago | 0.0 /100 | #300 | Tragic 6.3% |
| Trinidadians and Tobagonians | 0.0 /100 | #301 | Tragic 6.3% |
| West Indians | 0.0 /100 | #302 | Tragic 6.4% |
| Belizeans | 0.0 /100 | #303 | Tragic 6.4% |
| Immigrants | Jamaica | 0.0 /100 | #304 | Tragic 6.4% |
| Menominee | 0.0 /100 | #305 | Tragic 6.4% |
| Lumbee | 0.0 /100 | #306 | Tragic 6.4% |
| Immigrants | Bangladesh | 0.0 /100 | #307 | Tragic 6.5% |
| Barbadians | 0.0 /100 | #308 | Tragic 6.5% |
| Vietnamese | 0.0 /100 | #309 | Tragic 6.5% |