Pueblo vs Immigrants from Saudi Arabia Unemployment Among Ages 25 to 29 years
COMPARE
Pueblo
Immigrants from Saudi Arabia
Unemployment Among Ages 25 to 29 years
Unemployment Among Ages 25 to 29 years Comparison
Pueblo
Immigrants from Saudi Arabia
10.4%
UNEMPLOYMENT AMONG AGES 25 TO 29 YEARS
0.0/ 100
METRIC RATING
332nd/ 347
METRIC RANK
6.2%
UNEMPLOYMENT AMONG AGES 25 TO 29 YEARS
98.6/ 100
METRIC RATING
57th/ 347
METRIC RANK
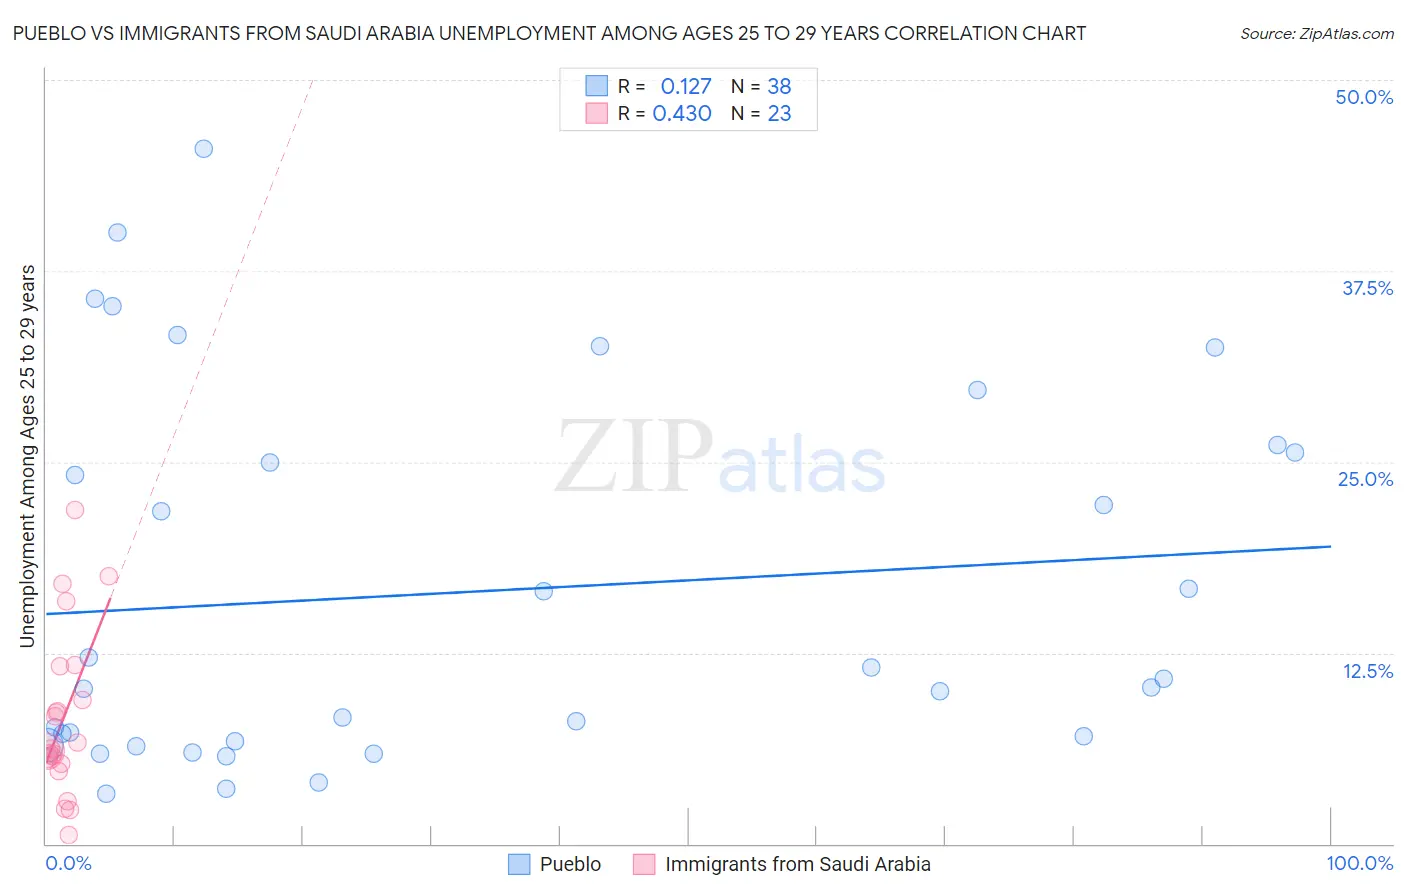
Pueblo vs Immigrants from Saudi Arabia Unemployment Among Ages 25 to 29 years Correlation Chart
The statistical analysis conducted on geographies consisting of 118,019,548 people shows a poor positive correlation between the proportion of Pueblo and unemployment rate among population between the ages 25 and 29 in the United States with a correlation coefficient (R) of 0.127 and weighted average of 10.4%. Similarly, the statistical analysis conducted on geographies consisting of 162,055,099 people shows a moderate positive correlation between the proportion of Immigrants from Saudi Arabia and unemployment rate among population between the ages 25 and 29 in the United States with a correlation coefficient (R) of 0.430 and weighted average of 6.2%, a difference of 67.9%.
Unemployment Among Ages 25 to 29 years Correlation Summary
| Measurement | Pueblo | Immigrants from Saudi Arabia |
| Minimum | 3.2% | 0.60% |
| Maximum | 45.5% | 21.9% |
| Range | 42.3% | 21.3% |
| Mean | 16.5% | 8.3% |
| Median | 10.5% | 6.2% |
| Interquartile 25% (IQ1) | 6.7% | 5.2% |
| Interquartile 75% (IQ3) | 25.6% | 11.6% |
| Interquartile Range (IQR) | 18.9% | 6.4% |
| Standard Deviation (Sample) | 12.1% | 5.4% |
| Standard Deviation (Population) | 11.9% | 5.3% |
Similar Demographics by Unemployment Among Ages 25 to 29 years
Demographics Similar to Pueblo by Unemployment Among Ages 25 to 29 years
In terms of unemployment among ages 25 to 29 years, the demographic groups most similar to Pueblo are Alaska Native (10.2%, a difference of 2.3%), Alaskan Athabascan (10.8%, a difference of 3.4%), Yuman (11.0%, a difference of 5.4%), Native/Alaskan (9.8%, a difference of 6.1%), and Puerto Rican (11.1%, a difference of 6.6%).
| Demographics | Rating | Rank | Unemployment Among Ages 25 to 29 years |
| Yakama | 0.0 /100 | #325 | Tragic 8.8% |
| Shoshone | 0.0 /100 | #326 | Tragic 9.2% |
| Colville | 0.0 /100 | #327 | Tragic 9.2% |
| Apache | 0.0 /100 | #328 | Tragic 9.5% |
| Aleuts | 0.0 /100 | #329 | Tragic 9.7% |
| Natives/Alaskans | 0.0 /100 | #330 | Tragic 9.8% |
| Alaska Natives | 0.0 /100 | #331 | Tragic 10.2% |
| Pueblo | 0.0 /100 | #332 | Tragic 10.4% |
| Alaskan Athabascans | 0.0 /100 | #333 | Tragic 10.8% |
| Yuman | 0.0 /100 | #334 | Tragic 11.0% |
| Puerto Ricans | 0.0 /100 | #335 | Tragic 11.1% |
| Lumbee | 0.0 /100 | #336 | Tragic 11.2% |
| Menominee | 0.0 /100 | #337 | Tragic 11.3% |
| Sioux | 0.0 /100 | #338 | Tragic 11.7% |
| Pima | 0.0 /100 | #339 | Tragic 11.8% |
Demographics Similar to Immigrants from Saudi Arabia by Unemployment Among Ages 25 to 29 years
In terms of unemployment among ages 25 to 29 years, the demographic groups most similar to Immigrants from Saudi Arabia are Immigrants from Burma/Myanmar (6.2%, a difference of 0.090%), Immigrants from Netherlands (6.2%, a difference of 0.11%), Immigrants from Eastern Asia (6.2%, a difference of 0.16%), Swedish (6.2%, a difference of 0.29%), and Luxembourger (6.2%, a difference of 0.29%).
| Demographics | Rating | Rank | Unemployment Among Ages 25 to 29 years |
| Soviet Union | 98.9 /100 | #50 | Exceptional 6.2% |
| Burmese | 98.9 /100 | #51 | Exceptional 6.2% |
| Immigrants | Turkey | 98.9 /100 | #52 | Exceptional 6.2% |
| Turks | 98.8 /100 | #53 | Exceptional 6.2% |
| Swedes | 98.8 /100 | #54 | Exceptional 6.2% |
| Immigrants | Netherlands | 98.7 /100 | #55 | Exceptional 6.2% |
| Immigrants | Burma/Myanmar | 98.7 /100 | #56 | Exceptional 6.2% |
| Immigrants | Saudi Arabia | 98.6 /100 | #57 | Exceptional 6.2% |
| Immigrants | Eastern Asia | 98.4 /100 | #58 | Exceptional 6.2% |
| Luxembourgers | 98.3 /100 | #59 | Exceptional 6.2% |
| Immigrants | Taiwan | 98.3 /100 | #60 | Exceptional 6.2% |
| Bhutanese | 98.2 /100 | #61 | Exceptional 6.2% |
| Immigrants | China | 98.1 /100 | #62 | Exceptional 6.2% |
| Kenyans | 98.0 /100 | #63 | Exceptional 6.3% |
| Immigrants | Sri Lanka | 97.9 /100 | #64 | Exceptional 6.3% |