Potawatomi vs Laotian Unemployment Among Ages 25 to 29 years
COMPARE
Potawatomi
Laotian
Unemployment Among Ages 25 to 29 years
Unemployment Among Ages 25 to 29 years Comparison
Potawatomi
Laotians
7.1%
UNEMPLOYMENT AMONG AGES 25 TO 29 YEARS
1.3/ 100
METRIC RATING
239th/ 347
METRIC RANK
6.5%
UNEMPLOYMENT AMONG AGES 25 TO 29 YEARS
83.6/ 100
METRIC RATING
123rd/ 347
METRIC RANK
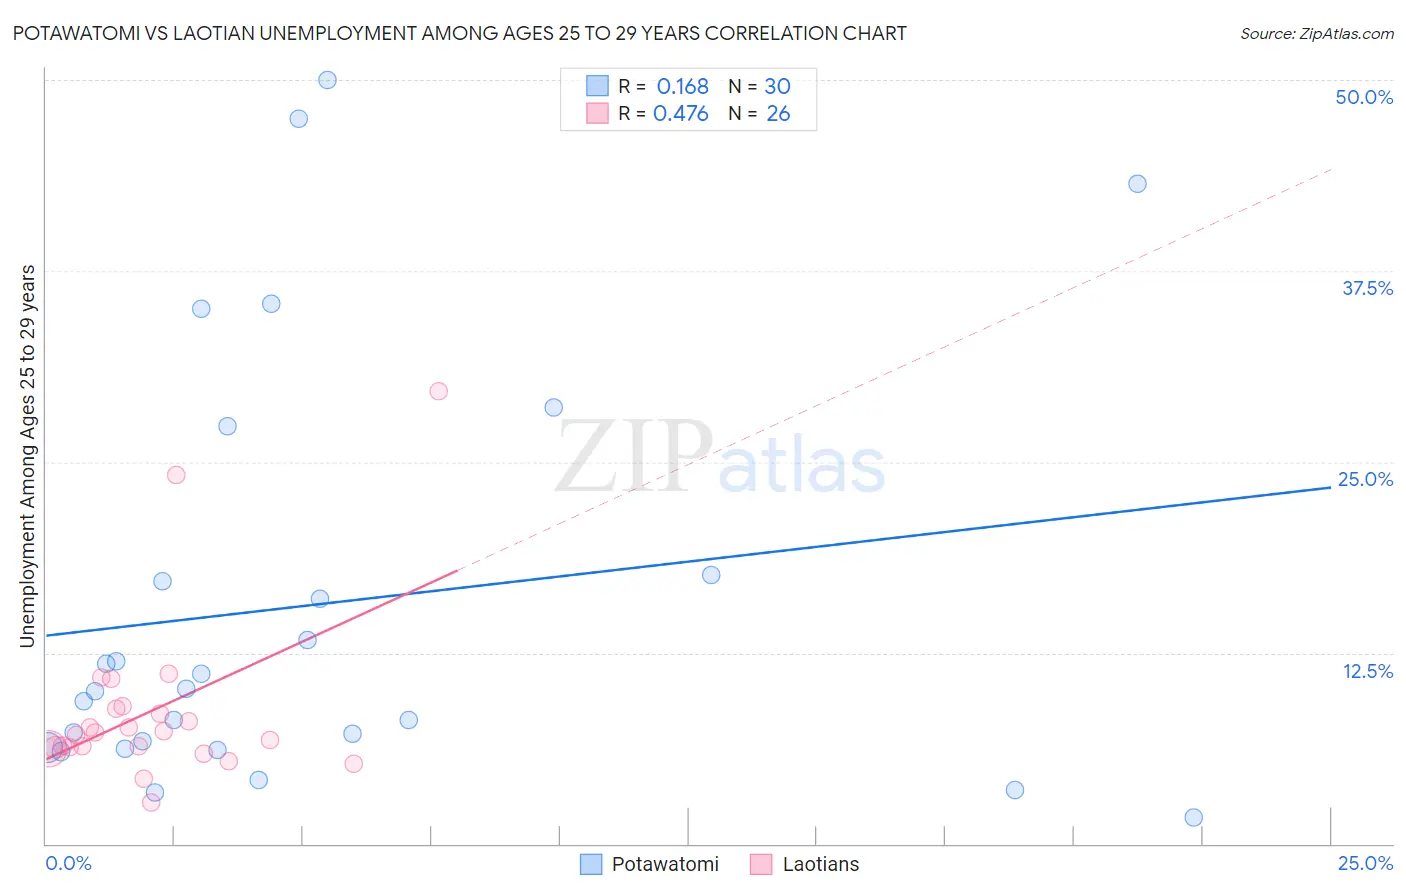
Potawatomi vs Laotian Unemployment Among Ages 25 to 29 years Correlation Chart
The statistical analysis conducted on geographies consisting of 114,824,106 people shows a poor positive correlation between the proportion of Potawatomi and unemployment rate among population between the ages 25 and 29 in the United States with a correlation coefficient (R) of 0.168 and weighted average of 7.1%. Similarly, the statistical analysis conducted on geographies consisting of 220,034,581 people shows a moderate positive correlation between the proportion of Laotians and unemployment rate among population between the ages 25 and 29 in the United States with a correlation coefficient (R) of 0.476 and weighted average of 6.5%, a difference of 9.4%.
Unemployment Among Ages 25 to 29 years Correlation Summary
| Measurement | Potawatomi | Laotian |
| Minimum | 1.7% | 2.7% |
| Maximum | 50.0% | 29.6% |
| Range | 48.3% | 26.9% |
| Mean | 15.7% | 8.7% |
| Median | 10.1% | 7.2% |
| Interquartile 25% (IQ1) | 6.3% | 6.3% |
| Interquartile 75% (IQ3) | 17.6% | 8.9% |
| Interquartile Range (IQR) | 11.3% | 2.6% |
| Standard Deviation (Sample) | 13.8% | 5.7% |
| Standard Deviation (Population) | 13.5% | 5.6% |
Similar Demographics by Unemployment Among Ages 25 to 29 years
Demographics Similar to Potawatomi by Unemployment Among Ages 25 to 29 years
In terms of unemployment among ages 25 to 29 years, the demographic groups most similar to Potawatomi are Native Hawaiian (7.1%, a difference of 0.030%), Immigrants from Sierra Leone (7.1%, a difference of 0.070%), Spanish American Indian (7.1%, a difference of 0.34%), Honduran (7.1%, a difference of 0.46%), and Yaqui (7.1%, a difference of 0.46%).
| Demographics | Rating | Rank | Unemployment Among Ages 25 to 29 years |
| Spanish Americans | 2.7 /100 | #232 | Tragic 7.0% |
| Immigrants | Honduras | 2.4 /100 | #233 | Tragic 7.0% |
| French Canadians | 2.4 /100 | #234 | Tragic 7.0% |
| Panamanians | 2.1 /100 | #235 | Tragic 7.0% |
| Cape Verdeans | 1.9 /100 | #236 | Tragic 7.0% |
| Puget Sound Salish | 1.8 /100 | #237 | Tragic 7.1% |
| Hondurans | 1.8 /100 | #238 | Tragic 7.1% |
| Potawatomi | 1.3 /100 | #239 | Tragic 7.1% |
| Native Hawaiians | 1.3 /100 | #240 | Tragic 7.1% |
| Immigrants | Sierra Leone | 1.3 /100 | #241 | Tragic 7.1% |
| Spanish American Indians | 1.1 /100 | #242 | Tragic 7.1% |
| Yaqui | 1.0 /100 | #243 | Tragic 7.1% |
| Immigrants | Nonimmigrants | 0.9 /100 | #244 | Tragic 7.1% |
| Guatemalans | 0.9 /100 | #245 | Tragic 7.1% |
| Immigrants | Uzbekistan | 0.7 /100 | #246 | Tragic 7.2% |
Demographics Similar to Laotians by Unemployment Among Ages 25 to 29 years
In terms of unemployment among ages 25 to 29 years, the demographic groups most similar to Laotians are Immigrants from Belarus (6.5%, a difference of 0.020%), Immigrants from Uganda (6.5%, a difference of 0.10%), Immigrants from Moldova (6.5%, a difference of 0.11%), Arab (6.5%, a difference of 0.12%), and Immigrants from South Africa (6.5%, a difference of 0.16%).
| Demographics | Rating | Rank | Unemployment Among Ages 25 to 29 years |
| Pakistanis | 85.9 /100 | #116 | Excellent 6.5% |
| Immigrants | Uruguay | 85.7 /100 | #117 | Excellent 6.5% |
| Chileans | 85.3 /100 | #118 | Excellent 6.5% |
| Immigrants | South Africa | 84.9 /100 | #119 | Excellent 6.5% |
| Immigrants | Moldova | 84.5 /100 | #120 | Excellent 6.5% |
| Immigrants | Uganda | 84.5 /100 | #121 | Excellent 6.5% |
| Immigrants | Belarus | 83.7 /100 | #122 | Excellent 6.5% |
| Laotians | 83.6 /100 | #123 | Excellent 6.5% |
| Arabs | 82.5 /100 | #124 | Excellent 6.5% |
| Syrians | 82.1 /100 | #125 | Excellent 6.5% |
| Brazilians | 81.9 /100 | #126 | Excellent 6.5% |
| Dutch | 80.6 /100 | #127 | Excellent 6.5% |
| Immigrants | Chile | 80.5 /100 | #128 | Excellent 6.5% |
| Sri Lankans | 80.3 /100 | #129 | Excellent 6.5% |
| Immigrants | Peru | 79.9 /100 | #130 | Good 6.5% |