Potawatomi vs Chippewa Unemployment Among Women with Children Under 6 years
COMPARE
Potawatomi
Chippewa
Unemployment Among Women with Children Under 6 years
Unemployment Among Women with Children Under 6 years Comparison
Potawatomi
Chippewa
9.6%
UNEMPLOYMENT AMONG WOMEN WITH CHILDREN UNDER 6 YEARS
0.0/ 100
METRIC RATING
320th/ 347
METRIC RANK
13.3%
UNEMPLOYMENT AMONG WOMEN WITH CHILDREN UNDER 6 YEARS
0.0/ 100
METRIC RATING
337th/ 347
METRIC RANK
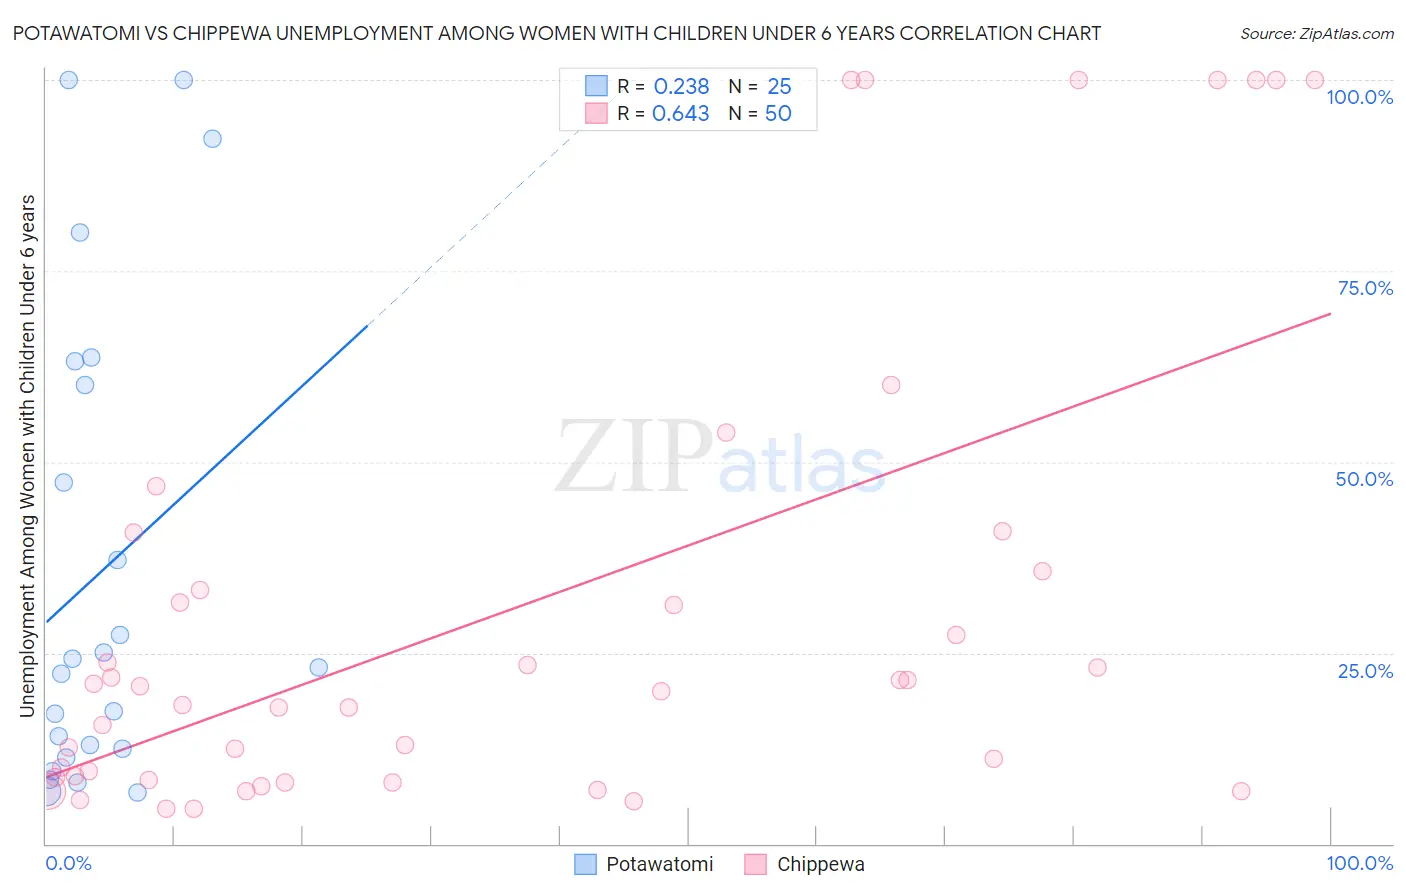
Potawatomi vs Chippewa Unemployment Among Women with Children Under 6 years Correlation Chart
The statistical analysis conducted on geographies consisting of 103,199,576 people shows a weak positive correlation between the proportion of Potawatomi and unemployment rate among women with children under the age of 6 in the United States with a correlation coefficient (R) of 0.238 and weighted average of 9.6%. Similarly, the statistical analysis conducted on geographies consisting of 172,974,941 people shows a significant positive correlation between the proportion of Chippewa and unemployment rate among women with children under the age of 6 in the United States with a correlation coefficient (R) of 0.643 and weighted average of 13.3%, a difference of 39.2%.
Unemployment Among Women with Children Under 6 years Correlation Summary
| Measurement | Potawatomi | Chippewa |
| Minimum | 6.7% | 4.6% |
| Maximum | 100.0% | 100.0% |
| Range | 93.3% | 95.4% |
| Mean | 35.6% | 30.7% |
| Median | 23.1% | 20.3% |
| Interquartile 25% (IQ1) | 11.9% | 8.7% |
| Interquartile 75% (IQ3) | 61.6% | 35.7% |
| Interquartile Range (IQR) | 49.7% | 26.9% |
| Standard Deviation (Sample) | 31.0% | 31.0% |
| Standard Deviation (Population) | 30.4% | 30.7% |
Demographics Similar to Potawatomi and Chippewa by Unemployment Among Women with Children Under 6 years
In terms of unemployment among women with children under 6 years, the demographic groups most similar to Potawatomi are Marshallese (9.6%, a difference of 0.050%), Central American Indian (9.6%, a difference of 0.060%), Alaska Native (9.6%, a difference of 0.31%), Immigrants from Bahamas (9.6%, a difference of 0.50%), and Osage (9.5%, a difference of 1.1%). Similarly, the demographic groups most similar to Chippewa are Pima (13.4%, a difference of 0.79%), Shoshone (13.2%, a difference of 1.1%), Puerto Rican (12.5%, a difference of 6.3%), Apache (12.3%, a difference of 8.2%), and Native/Alaskan (11.5%, a difference of 15.7%).
| Demographics | Rating | Rank | Unemployment Among Women with Children Under 6 years |
| Osage | 0.0 /100 | #318 | Tragic 9.5% |
| Marshallese | 0.0 /100 | #319 | Tragic 9.6% |
| Potawatomi | 0.0 /100 | #320 | Tragic 9.6% |
| Central American Indians | 0.0 /100 | #321 | Tragic 9.6% |
| Alaska Natives | 0.0 /100 | #322 | Tragic 9.6% |
| Immigrants | Bahamas | 0.0 /100 | #323 | Tragic 9.6% |
| Paiute | 0.0 /100 | #324 | Tragic 9.7% |
| Choctaw | 0.0 /100 | #325 | Tragic 9.8% |
| Delaware | 0.0 /100 | #326 | Tragic 9.8% |
| Ottawa | 0.0 /100 | #327 | Tragic 9.9% |
| Tohono O'odham | 0.0 /100 | #328 | Tragic 10.2% |
| Blacks/African Americans | 0.0 /100 | #329 | Tragic 10.3% |
| Pennsylvania Germans | 0.0 /100 | #330 | Tragic 10.8% |
| Colville | 0.0 /100 | #331 | Tragic 11.2% |
| Sioux | 0.0 /100 | #332 | Tragic 11.5% |
| Natives/Alaskans | 0.0 /100 | #333 | Tragic 11.5% |
| Apache | 0.0 /100 | #334 | Tragic 12.3% |
| Puerto Ricans | 0.0 /100 | #335 | Tragic 12.5% |
| Shoshone | 0.0 /100 | #336 | Tragic 13.2% |
| Chippewa | 0.0 /100 | #337 | Tragic 13.3% |
| Pima | 0.0 /100 | #338 | Tragic 13.4% |