Portuguese vs Israeli Unemployment Among Ages 16 to 19 years
COMPARE
Portuguese
Israeli
Unemployment Among Ages 16 to 19 years
Unemployment Among Ages 16 to 19 years Comparison
Portuguese
Israelis
17.4%
UNEMPLOYMENT AMONG AGES 16 TO 19 YEARS
67.3/ 100
METRIC RATING
155th/ 347
METRIC RANK
19.0%
UNEMPLOYMENT AMONG AGES 16 TO 19 YEARS
0.1/ 100
METRIC RATING
267th/ 347
METRIC RANK
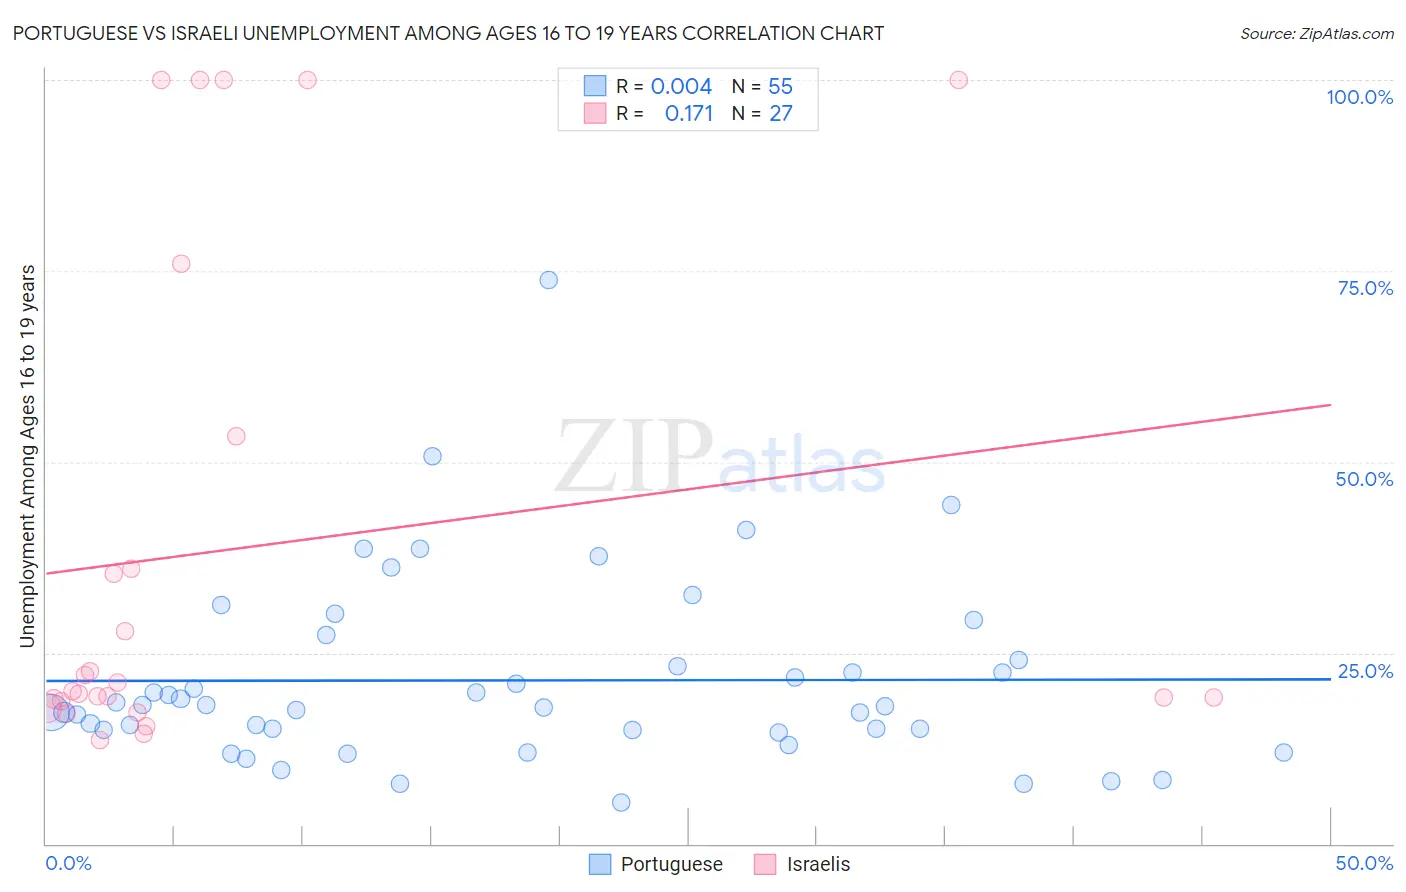
Portuguese vs Israeli Unemployment Among Ages 16 to 19 years Correlation Chart
The statistical analysis conducted on geographies consisting of 420,400,969 people shows no correlation between the proportion of Portuguese and unemployment rate among population between the ages 16 and 19 in the United States with a correlation coefficient (R) of 0.004 and weighted average of 17.4%. Similarly, the statistical analysis conducted on geographies consisting of 204,167,490 people shows a poor positive correlation between the proportion of Israelis and unemployment rate among population between the ages 16 and 19 in the United States with a correlation coefficient (R) of 0.171 and weighted average of 19.0%, a difference of 9.3%.
Unemployment Among Ages 16 to 19 years Correlation Summary
| Measurement | Portuguese | Israeli |
| Minimum | 5.4% | 13.6% |
| Maximum | 73.9% | 100.0% |
| Range | 68.5% | 86.4% |
| Mean | 21.4% | 38.7% |
| Median | 18.0% | 20.0% |
| Interquartile 25% (IQ1) | 14.8% | 18.7% |
| Interquartile 75% (IQ3) | 24.0% | 53.3% |
| Interquartile Range (IQR) | 9.2% | 34.6% |
| Standard Deviation (Sample) | 12.3% | 32.5% |
| Standard Deviation (Population) | 12.2% | 31.9% |
Similar Demographics by Unemployment Among Ages 16 to 19 years
Demographics Similar to Portuguese by Unemployment Among Ages 16 to 19 years
In terms of unemployment among ages 16 to 19 years, the demographic groups most similar to Portuguese are Afghan (17.4%, a difference of 0.050%), Immigrants from Afghanistan (17.4%, a difference of 0.070%), Costa Rican (17.4%, a difference of 0.070%), Immigrants from Northern Africa (17.4%, a difference of 0.090%), and Immigrants from Hong Kong (17.4%, a difference of 0.11%).
| Demographics | Rating | Rank | Unemployment Among Ages 16 to 19 years |
| Romanians | 74.9 /100 | #148 | Good 17.3% |
| Immigrants | Eastern Asia | 73.8 /100 | #149 | Good 17.4% |
| Immigrants | Northern Europe | 72.5 /100 | #150 | Good 17.4% |
| Immigrants | Hong Kong | 69.3 /100 | #151 | Good 17.4% |
| Immigrants | Northern Africa | 69.0 /100 | #152 | Good 17.4% |
| Immigrants | Afghanistan | 68.6 /100 | #153 | Good 17.4% |
| Afghans | 68.1 /100 | #154 | Good 17.4% |
| Portuguese | 67.3 /100 | #155 | Good 17.4% |
| Costa Ricans | 65.9 /100 | #156 | Good 17.4% |
| Uruguayans | 64.3 /100 | #157 | Good 17.5% |
| Immigrants | China | 64.1 /100 | #158 | Good 17.5% |
| Koreans | 61.0 /100 | #159 | Good 17.5% |
| Ukrainians | 60.5 /100 | #160 | Good 17.5% |
| Immigrants | Denmark | 60.3 /100 | #161 | Good 17.5% |
| Immigrants | Norway | 59.8 /100 | #162 | Average 17.5% |
Demographics Similar to Israelis by Unemployment Among Ages 16 to 19 years
In terms of unemployment among ages 16 to 19 years, the demographic groups most similar to Israelis are Immigrants from El Salvador (19.1%, a difference of 0.28%), Immigrants from Honduras (19.0%, a difference of 0.34%), Lumbee (19.1%, a difference of 0.36%), Choctaw (19.0%, a difference of 0.43%), and Yaqui (19.0%, a difference of 0.45%).
| Demographics | Rating | Rank | Unemployment Among Ages 16 to 19 years |
| Nigerians | 0.2 /100 | #260 | Tragic 18.9% |
| Spanish American Indians | 0.1 /100 | #261 | Tragic 18.9% |
| Salvadorans | 0.1 /100 | #262 | Tragic 18.9% |
| Cree | 0.1 /100 | #263 | Tragic 19.0% |
| Yaqui | 0.1 /100 | #264 | Tragic 19.0% |
| Choctaw | 0.1 /100 | #265 | Tragic 19.0% |
| Immigrants | Honduras | 0.1 /100 | #266 | Tragic 19.0% |
| Israelis | 0.1 /100 | #267 | Tragic 19.0% |
| Immigrants | El Salvador | 0.1 /100 | #268 | Tragic 19.1% |
| Lumbee | 0.1 /100 | #269 | Tragic 19.1% |
| Hondurans | 0.1 /100 | #270 | Tragic 19.2% |
| Blackfeet | 0.0 /100 | #271 | Tragic 19.2% |
| Hispanics or Latinos | 0.0 /100 | #272 | Tragic 19.2% |
| Immigrants | Panama | 0.0 /100 | #273 | Tragic 19.3% |
| Shoshone | 0.0 /100 | #274 | Tragic 19.3% |