Portuguese vs Immigrants from Fiji Unemployment Among Ages 30 to 34 years
COMPARE
Portuguese
Immigrants from Fiji
Unemployment Among Ages 30 to 34 years
Unemployment Among Ages 30 to 34 years Comparison
Portuguese
Immigrants from Fiji
5.9%
UNEMPLOYMENT AMONG AGES 30 TO 34 YEARS
0.8/ 100
METRIC RATING
234th/ 347
METRIC RANK
5.7%
UNEMPLOYMENT AMONG AGES 30 TO 34 YEARS
5.1/ 100
METRIC RATING
217th/ 347
METRIC RANK
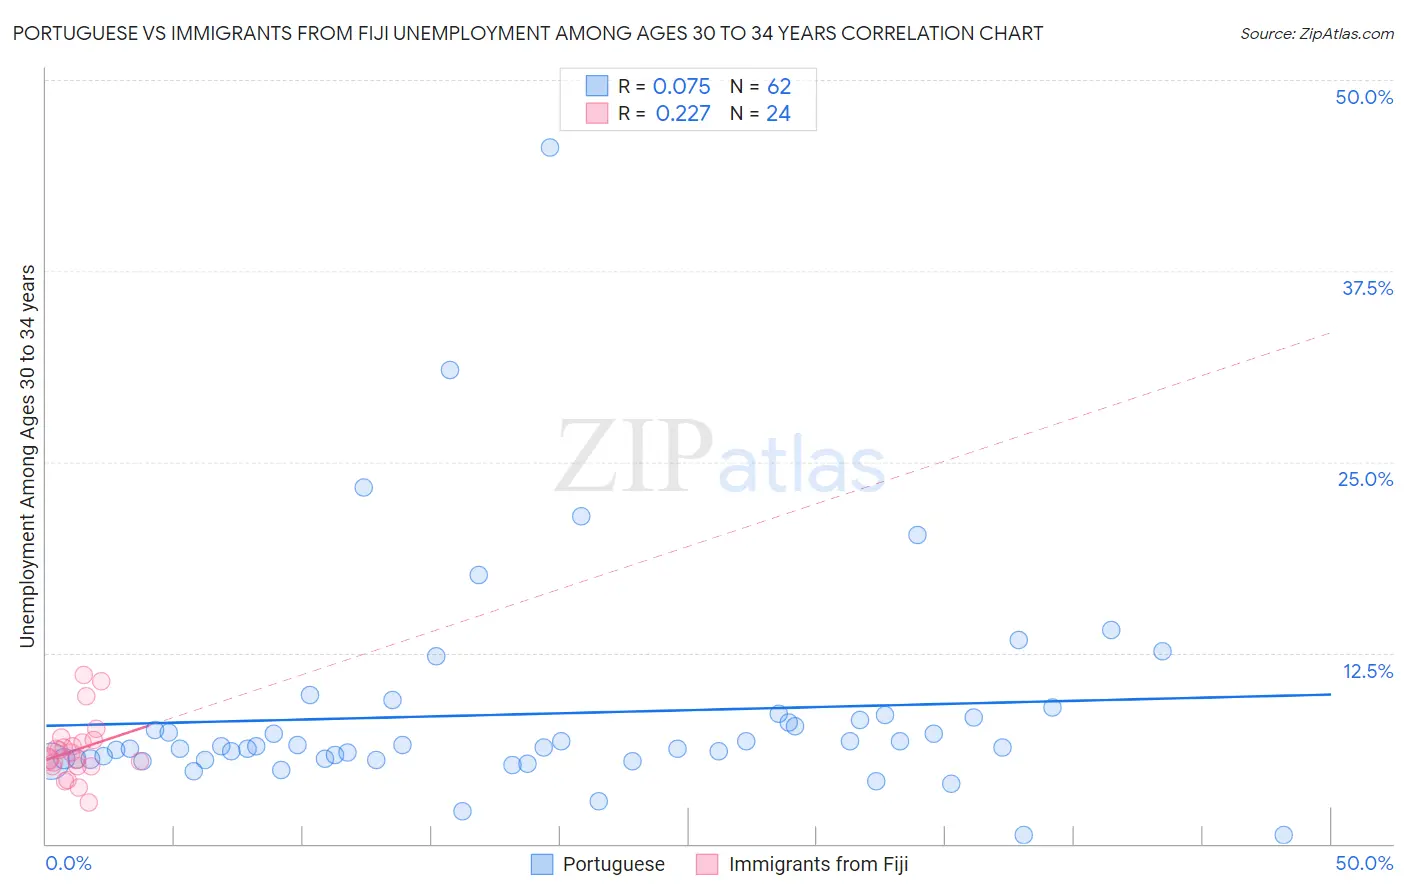
Portuguese vs Immigrants from Fiji Unemployment Among Ages 30 to 34 years Correlation Chart
The statistical analysis conducted on geographies consisting of 416,195,199 people shows a slight positive correlation between the proportion of Portuguese and unemployment rate among population between the ages 30 and 34 in the United States with a correlation coefficient (R) of 0.075 and weighted average of 5.9%. Similarly, the statistical analysis conducted on geographies consisting of 92,907,777 people shows a weak positive correlation between the proportion of Immigrants from Fiji and unemployment rate among population between the ages 30 and 34 in the United States with a correlation coefficient (R) of 0.227 and weighted average of 5.7%, a difference of 3.1%.
Unemployment Among Ages 30 to 34 years Correlation Summary
| Measurement | Portuguese | Immigrants from Fiji |
| Minimum | 0.60% | 2.7% |
| Maximum | 45.5% | 11.0% |
| Range | 44.9% | 8.3% |
| Mean | 8.5% | 6.1% |
| Median | 6.3% | 5.8% |
| Interquartile 25% (IQ1) | 5.6% | 5.1% |
| Interquartile 75% (IQ3) | 8.3% | 6.7% |
| Interquartile Range (IQR) | 2.7% | 1.6% |
| Standard Deviation (Sample) | 7.1% | 2.0% |
| Standard Deviation (Population) | 7.0% | 2.0% |
Demographics Similar to Portuguese and Immigrants from Fiji by Unemployment Among Ages 30 to 34 years
In terms of unemployment among ages 30 to 34 years, the demographic groups most similar to Portuguese are Nepalese (5.9%, a difference of 0.030%), Yaqui (5.9%, a difference of 0.12%), Iroquois (5.9%, a difference of 0.41%), Japanese (5.9%, a difference of 0.54%), and Hawaiian (5.9%, a difference of 0.67%). Similarly, the demographic groups most similar to Immigrants from Fiji are Immigrants from Syria (5.7%, a difference of 0.14%), Panamanian (5.8%, a difference of 0.21%), Immigrants from Cambodia (5.7%, a difference of 0.24%), French Canadian (5.8%, a difference of 0.24%), and Sierra Leonean (5.8%, a difference of 0.45%).
| Demographics | Rating | Rank | Unemployment Among Ages 30 to 34 years |
| Immigrants | Cambodia | 5.8 /100 | #215 | Tragic 5.7% |
| Immigrants | Syria | 5.5 /100 | #216 | Tragic 5.7% |
| Immigrants | Fiji | 5.1 /100 | #217 | Tragic 5.7% |
| Panamanians | 4.5 /100 | #218 | Tragic 5.8% |
| French Canadians | 4.4 /100 | #219 | Tragic 5.8% |
| Sierra Leoneans | 3.9 /100 | #220 | Tragic 5.8% |
| Guamanians/Chamorros | 3.9 /100 | #221 | Tragic 5.8% |
| Spaniards | 3.2 /100 | #222 | Tragic 5.8% |
| Bermudans | 2.7 /100 | #223 | Tragic 5.8% |
| Slovaks | 2.5 /100 | #224 | Tragic 5.8% |
| Samoans | 2.5 /100 | #225 | Tragic 5.8% |
| Liberians | 2.3 /100 | #226 | Tragic 5.8% |
| Spanish | 1.8 /100 | #227 | Tragic 5.8% |
| Immigrants | Bahamas | 1.8 /100 | #228 | Tragic 5.8% |
| Immigrants | Uzbekistan | 1.5 /100 | #229 | Tragic 5.9% |
| Hawaiians | 1.2 /100 | #230 | Tragic 5.9% |
| Japanese | 1.1 /100 | #231 | Tragic 5.9% |
| Iroquois | 1.0 /100 | #232 | Tragic 5.9% |
| Nepalese | 0.8 /100 | #233 | Tragic 5.9% |
| Portuguese | 0.8 /100 | #234 | Tragic 5.9% |
| Yaqui | 0.7 /100 | #235 | Tragic 5.9% |