Polish vs Soviet Union Female Unemployment
COMPARE
Polish
Soviet Union
Female Unemployment
Female Unemployment Comparison
Poles
Soviet Union
4.7%
FEMALE UNEMPLOYMENT
99.9/ 100
METRIC RATING
19th/ 347
METRIC RANK
5.4%
FEMALE UNEMPLOYMENT
21.7/ 100
METRIC RATING
200th/ 347
METRIC RANK
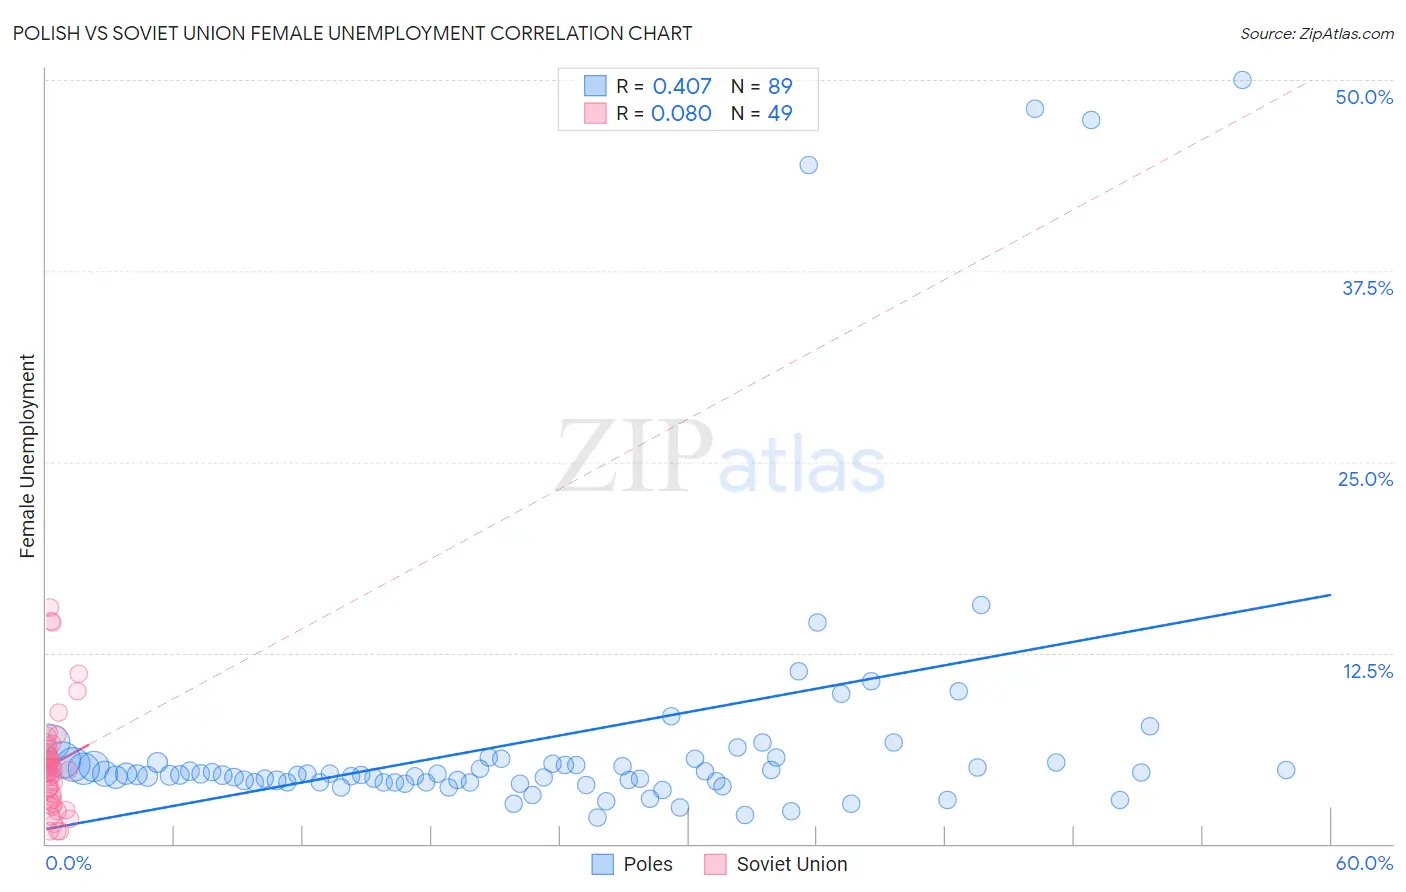
Polish vs Soviet Union Female Unemployment Correlation Chart
The statistical analysis conducted on geographies consisting of 548,133,946 people shows a moderate positive correlation between the proportion of Poles and unemploymnet rate among females in the United States with a correlation coefficient (R) of 0.407 and weighted average of 4.7%. Similarly, the statistical analysis conducted on geographies consisting of 43,498,217 people shows a slight positive correlation between the proportion of Soviet Union and unemploymnet rate among females in the United States with a correlation coefficient (R) of 0.080 and weighted average of 5.4%, a difference of 14.4%.
Female Unemployment Correlation Summary
| Measurement | Polish | Soviet Union |
| Minimum | 1.7% | 0.80% |
| Maximum | 50.0% | 15.5% |
| Range | 48.3% | 14.7% |
| Mean | 6.9% | 5.2% |
| Median | 4.5% | 4.9% |
| Interquartile 25% (IQ1) | 4.0% | 2.9% |
| Interquartile 75% (IQ3) | 5.3% | 6.1% |
| Interquartile Range (IQR) | 1.3% | 3.2% |
| Standard Deviation (Sample) | 9.1% | 3.3% |
| Standard Deviation (Population) | 9.1% | 3.3% |
Similar Demographics by Female Unemployment
Demographics Similar to Poles by Female Unemployment
In terms of female unemployment, the demographic groups most similar to Poles are Latvian (4.7%, a difference of 0.010%), Bulgarian (4.7%, a difference of 0.080%), Fijian (4.7%, a difference of 0.090%), European (4.7%, a difference of 0.11%), and Croatian (4.7%, a difference of 0.16%).
| Demographics | Rating | Rank | Female Unemployment |
| Dutch | 100.0 /100 | #12 | Exceptional 4.6% |
| Belgians | 100.0 /100 | #13 | Exceptional 4.6% |
| Finns | 100.0 /100 | #14 | Exceptional 4.6% |
| English | 100.0 /100 | #15 | Exceptional 4.6% |
| Carpatho Rusyns | 99.9 /100 | #16 | Exceptional 4.7% |
| Croatians | 99.9 /100 | #17 | Exceptional 4.7% |
| Latvians | 99.9 /100 | #18 | Exceptional 4.7% |
| Poles | 99.9 /100 | #19 | Exceptional 4.7% |
| Bulgarians | 99.9 /100 | #20 | Exceptional 4.7% |
| Fijians | 99.9 /100 | #21 | Exceptional 4.7% |
| Europeans | 99.9 /100 | #22 | Exceptional 4.7% |
| Scottish | 99.9 /100 | #23 | Exceptional 4.7% |
| Welsh | 99.9 /100 | #24 | Exceptional 4.7% |
| Immigrants | India | 99.9 /100 | #25 | Exceptional 4.7% |
| Immigrants | Bosnia and Herzegovina | 99.9 /100 | #26 | Exceptional 4.7% |
Demographics Similar to Soviet Union by Female Unemployment
In terms of female unemployment, the demographic groups most similar to Soviet Union are Hawaiian (5.4%, a difference of 0.040%), Immigrants from Middle Africa (5.4%, a difference of 0.080%), Iroquois (5.4%, a difference of 0.080%), Tsimshian (5.4%, a difference of 0.12%), and Immigrants from South Eastern Asia (5.4%, a difference of 0.12%).
| Demographics | Rating | Rank | Female Unemployment |
| Arabs | 27.7 /100 | #193 | Fair 5.3% |
| Colombians | 27.0 /100 | #194 | Fair 5.3% |
| Immigrants | Colombia | 26.2 /100 | #195 | Fair 5.3% |
| Spaniards | 25.2 /100 | #196 | Fair 5.3% |
| Alsatians | 23.9 /100 | #197 | Fair 5.3% |
| Tsimshian | 23.1 /100 | #198 | Fair 5.4% |
| Hawaiians | 22.2 /100 | #199 | Fair 5.4% |
| Soviet Union | 21.7 /100 | #200 | Fair 5.4% |
| Immigrants | Middle Africa | 20.8 /100 | #201 | Fair 5.4% |
| Iroquois | 20.8 /100 | #202 | Fair 5.4% |
| Immigrants | South Eastern Asia | 20.3 /100 | #203 | Fair 5.4% |
| Immigrants | Israel | 19.7 /100 | #204 | Poor 5.4% |
| Immigrants | Afghanistan | 18.9 /100 | #205 | Poor 5.4% |
| Immigrants | Brazil | 18.8 /100 | #206 | Poor 5.4% |
| Creek | 15.4 /100 | #207 | Poor 5.4% |