Polish vs Immigrants from Iraq Unemployment Among Ages 30 to 34 years
COMPARE
Polish
Immigrants from Iraq
Unemployment Among Ages 30 to 34 years
Unemployment Among Ages 30 to 34 years Comparison
Poles
Immigrants from Iraq
5.3%
UNEMPLOYMENT AMONG AGES 30 TO 34 YEARS
78.8/ 100
METRIC RATING
129th/ 347
METRIC RANK
5.1%
UNEMPLOYMENT AMONG AGES 30 TO 34 YEARS
96.4/ 100
METRIC RATING
70th/ 347
METRIC RANK
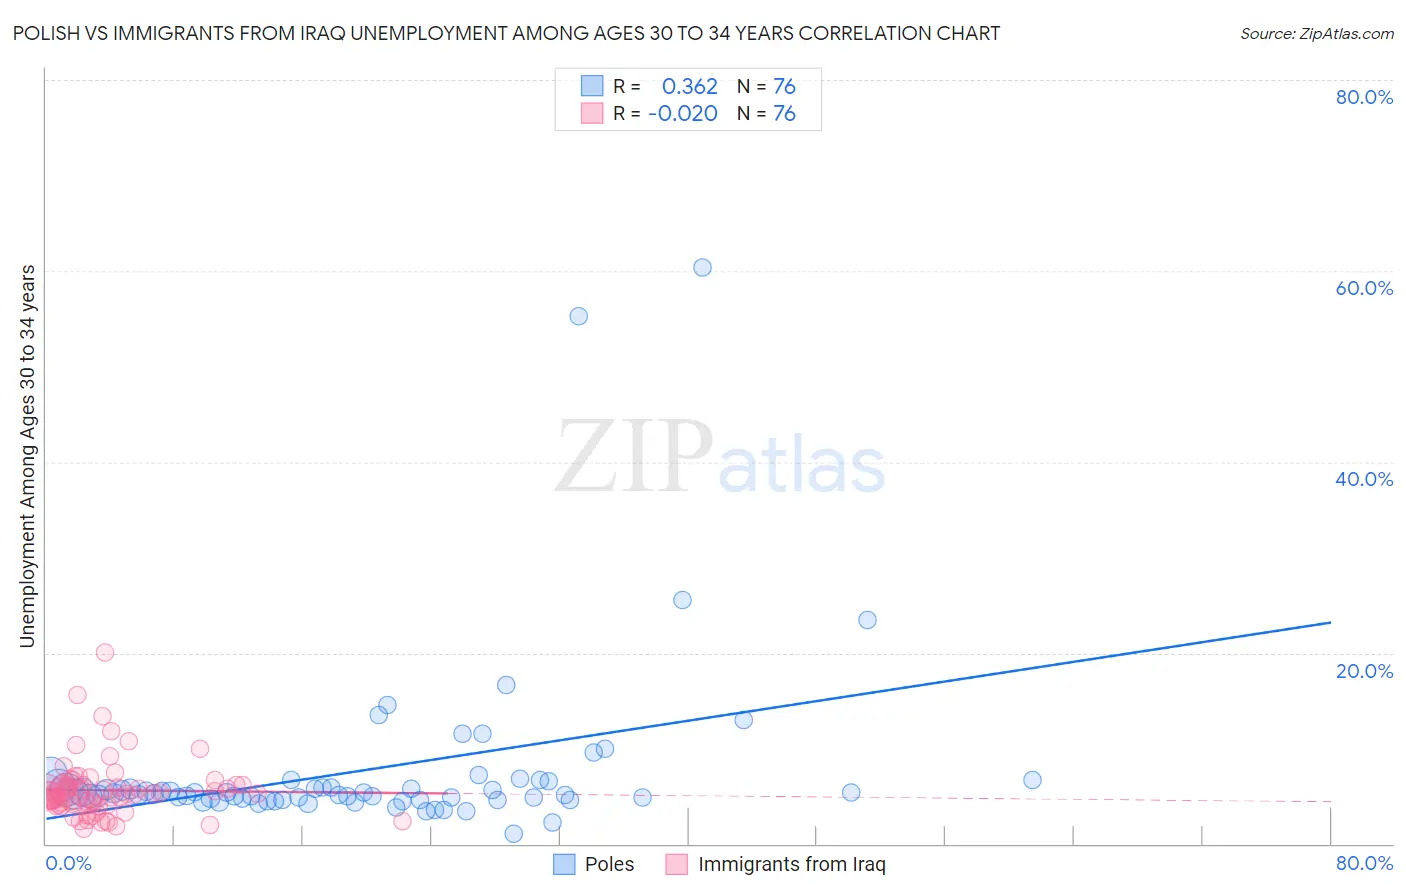
Polish vs Immigrants from Iraq Unemployment Among Ages 30 to 34 years Correlation Chart
The statistical analysis conducted on geographies consisting of 491,664,847 people shows a mild positive correlation between the proportion of Poles and unemployment rate among population between the ages 30 and 34 in the United States with a correlation coefficient (R) of 0.362 and weighted average of 5.3%. Similarly, the statistical analysis conducted on geographies consisting of 190,186,520 people shows no correlation between the proportion of Immigrants from Iraq and unemployment rate among population between the ages 30 and 34 in the United States with a correlation coefficient (R) of -0.020 and weighted average of 5.1%, a difference of 3.7%.
Unemployment Among Ages 30 to 34 years Correlation Summary
| Measurement | Polish | Immigrants from Iraq |
| Minimum | 1.1% | 1.6% |
| Maximum | 60.4% | 20.0% |
| Range | 59.3% | 18.4% |
| Mean | 7.7% | 5.6% |
| Median | 5.3% | 5.2% |
| Interquartile 25% (IQ1) | 4.7% | 4.0% |
| Interquartile 75% (IQ3) | 6.3% | 6.1% |
| Interquartile Range (IQR) | 1.7% | 2.1% |
| Standard Deviation (Sample) | 9.2% | 3.0% |
| Standard Deviation (Population) | 9.1% | 3.0% |
Similar Demographics by Unemployment Among Ages 30 to 34 years
Demographics Similar to Poles by Unemployment Among Ages 30 to 34 years
In terms of unemployment among ages 30 to 34 years, the demographic groups most similar to Poles are Immigrants from Uruguay (5.3%, a difference of 0.060%), Taiwanese (5.3%, a difference of 0.070%), German (5.3%, a difference of 0.10%), Immigrants from Eastern Europe (5.3%, a difference of 0.14%), and Carpatho Rusyn (5.3%, a difference of 0.15%).
| Demographics | Rating | Rank | Unemployment Among Ages 30 to 34 years |
| Immigrants | Netherlands | 81.8 /100 | #122 | Excellent 5.3% |
| Immigrants | Italy | 81.1 /100 | #123 | Excellent 5.3% |
| Immigrants | Brazil | 80.8 /100 | #124 | Excellent 5.3% |
| Greeks | 80.4 /100 | #125 | Excellent 5.3% |
| Immigrants | Sri Lanka | 80.2 /100 | #126 | Excellent 5.3% |
| Taiwanese | 79.4 /100 | #127 | Good 5.3% |
| Immigrants | Uruguay | 79.3 /100 | #128 | Good 5.3% |
| Poles | 78.8 /100 | #129 | Good 5.3% |
| Germans | 77.8 /100 | #130 | Good 5.3% |
| Immigrants | Eastern Europe | 77.4 /100 | #131 | Good 5.3% |
| Carpatho Rusyns | 77.3 /100 | #132 | Good 5.3% |
| Immigrants | Northern Europe | 77.3 /100 | #133 | Good 5.3% |
| Bangladeshis | 76.6 /100 | #134 | Good 5.3% |
| Palestinians | 75.1 /100 | #135 | Good 5.4% |
| Pakistanis | 74.6 /100 | #136 | Good 5.4% |
Demographics Similar to Immigrants from Iraq by Unemployment Among Ages 30 to 34 years
In terms of unemployment among ages 30 to 34 years, the demographic groups most similar to Immigrants from Iraq are Immigrants from Northern Africa (5.1%, a difference of 0.0%), Paraguayan (5.1%, a difference of 0.0%), Jordanian (5.1%, a difference of 0.010%), Burmese (5.1%, a difference of 0.020%), and Immigrants from Moldova (5.1%, a difference of 0.020%).
| Demographics | Rating | Rank | Unemployment Among Ages 30 to 34 years |
| Belgians | 97.0 /100 | #63 | Exceptional 5.1% |
| Immigrants | Eastern Asia | 96.9 /100 | #64 | Exceptional 5.1% |
| Immigrants | Japan | 96.8 /100 | #65 | Exceptional 5.1% |
| Immigrants | Zimbabwe | 96.7 /100 | #66 | Exceptional 5.1% |
| Burmese | 96.5 /100 | #67 | Exceptional 5.1% |
| Jordanians | 96.5 /100 | #68 | Exceptional 5.1% |
| Immigrants | Northern Africa | 96.4 /100 | #69 | Exceptional 5.1% |
| Immigrants | Iraq | 96.4 /100 | #70 | Exceptional 5.1% |
| Paraguayans | 96.4 /100 | #71 | Exceptional 5.1% |
| Immigrants | Moldova | 96.4 /100 | #72 | Exceptional 5.1% |
| Slovenes | 96.2 /100 | #73 | Exceptional 5.2% |
| Immigrants | Asia | 96.2 /100 | #74 | Exceptional 5.2% |
| Iranians | 96.0 /100 | #75 | Exceptional 5.2% |
| Scandinavians | 95.6 /100 | #76 | Exceptional 5.2% |
| Uruguayans | 95.4 /100 | #77 | Exceptional 5.2% |