Polish vs Immigrants from Chile Unemployment Among Youth under 25 years
COMPARE
Polish
Immigrants from Chile
Unemployment Among Youth under 25 years
Unemployment Among Youth under 25 years Comparison
Poles
Immigrants from Chile
11.0%
UNEMPLOYMENT AMONG YOUTH UNDER 25 YEARS
99.3/ 100
METRIC RATING
48th/ 347
METRIC RANK
11.4%
UNEMPLOYMENT AMONG YOUTH UNDER 25 YEARS
80.4/ 100
METRIC RATING
134th/ 347
METRIC RANK
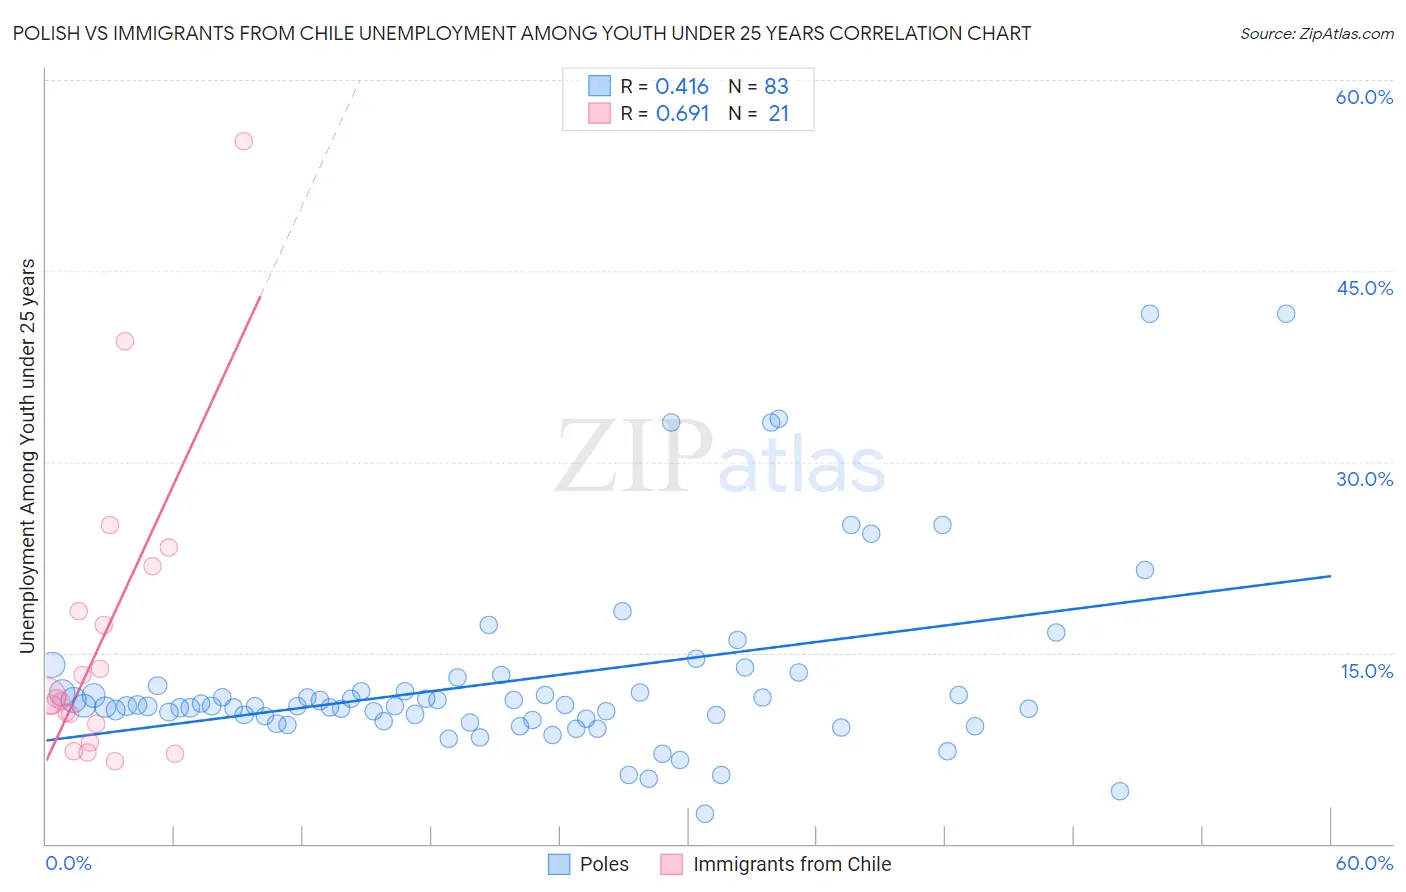
Polish vs Immigrants from Chile Unemployment Among Youth under 25 years Correlation Chart
The statistical analysis conducted on geographies consisting of 537,929,649 people shows a moderate positive correlation between the proportion of Poles and unemployment rate among youth under the age of 25 in the United States with a correlation coefficient (R) of 0.416 and weighted average of 11.0%. Similarly, the statistical analysis conducted on geographies consisting of 217,800,167 people shows a significant positive correlation between the proportion of Immigrants from Chile and unemployment rate among youth under the age of 25 in the United States with a correlation coefficient (R) of 0.691 and weighted average of 11.4%, a difference of 3.9%.
Unemployment Among Youth under 25 years Correlation Summary
| Measurement | Polish | Immigrants from Chile |
| Minimum | 2.4% | 6.5% |
| Maximum | 41.6% | 55.2% |
| Range | 39.2% | 48.7% |
| Mean | 12.8% | 16.1% |
| Median | 10.8% | 11.4% |
| Interquartile 25% (IQ1) | 9.7% | 8.7% |
| Interquartile 75% (IQ3) | 12.0% | 20.0% |
| Interquartile Range (IQR) | 2.3% | 11.4% |
| Standard Deviation (Sample) | 7.2% | 12.0% |
| Standard Deviation (Population) | 7.2% | 11.7% |
Similar Demographics by Unemployment Among Youth under 25 years
Demographics Similar to Poles by Unemployment Among Youth under 25 years
In terms of unemployment among youth under 25 years, the demographic groups most similar to Poles are Thai (11.0%, a difference of 0.070%), Czechoslovakian (11.0%, a difference of 0.17%), Serbian (11.0%, a difference of 0.40%), Latvian (11.0%, a difference of 0.42%), and Ottawa (11.1%, a difference of 0.50%).
| Demographics | Rating | Rank | Unemployment Among Youth under 25 years |
| Croatians | 99.8 /100 | #41 | Exceptional 10.9% |
| Cambodians | 99.7 /100 | #42 | Exceptional 10.9% |
| British | 99.7 /100 | #43 | Exceptional 10.9% |
| Welsh | 99.7 /100 | #44 | Exceptional 10.9% |
| Bulgarians | 99.6 /100 | #45 | Exceptional 10.9% |
| Tongans | 99.6 /100 | #46 | Exceptional 10.9% |
| Australians | 99.6 /100 | #47 | Exceptional 10.9% |
| Poles | 99.3 /100 | #48 | Exceptional 11.0% |
| Thais | 99.3 /100 | #49 | Exceptional 11.0% |
| Czechoslovakians | 99.2 /100 | #50 | Exceptional 11.0% |
| Serbians | 99.0 /100 | #51 | Exceptional 11.0% |
| Latvians | 99.0 /100 | #52 | Exceptional 11.0% |
| Ottawa | 99.0 /100 | #53 | Exceptional 11.1% |
| Mongolians | 98.9 /100 | #54 | Exceptional 11.1% |
| Irish | 98.9 /100 | #55 | Exceptional 11.1% |
Demographics Similar to Immigrants from Chile by Unemployment Among Youth under 25 years
In terms of unemployment among youth under 25 years, the demographic groups most similar to Immigrants from Chile are Immigrants from Oceania (11.4%, a difference of 0.010%), Romanian (11.4%, a difference of 0.020%), Asian (11.4%, a difference of 0.050%), Immigrants from England (11.5%, a difference of 0.15%), and Immigrants from Indonesia (11.5%, a difference of 0.17%).
| Demographics | Rating | Rank | Unemployment Among Youth under 25 years |
| Greeks | 86.2 /100 | #127 | Excellent 11.4% |
| Immigrants | Hungary | 86.0 /100 | #128 | Excellent 11.4% |
| Turks | 85.8 /100 | #129 | Excellent 11.4% |
| Hungarians | 85.7 /100 | #130 | Excellent 11.4% |
| Immigrants | Spain | 84.6 /100 | #131 | Excellent 11.4% |
| Ethiopians | 83.2 /100 | #132 | Excellent 11.4% |
| Lebanese | 83.1 /100 | #133 | Excellent 11.4% |
| Immigrants | Chile | 80.4 /100 | #134 | Excellent 11.4% |
| Immigrants | Oceania | 80.2 /100 | #135 | Excellent 11.4% |
| Romanians | 80.1 /100 | #136 | Excellent 11.4% |
| Asians | 79.7 /100 | #137 | Good 11.4% |
| Immigrants | England | 78.1 /100 | #138 | Good 11.5% |
| Immigrants | Indonesia | 77.6 /100 | #139 | Good 11.5% |
| Immigrants | Belgium | 77.5 /100 | #140 | Good 11.5% |
| Immigrants | Uruguay | 76.1 /100 | #141 | Good 11.5% |