Polish vs Fijian Male Unemployment
COMPARE
Polish
Fijian
Male Unemployment
Male Unemployment Comparison
Poles
Fijians
4.9%
MALE UNEMPLOYMENT
98.9/ 100
METRIC RATING
49th/ 347
METRIC RANK
5.2%
MALE UNEMPLOYMENT
78.3/ 100
METRIC RATING
142nd/ 347
METRIC RANK
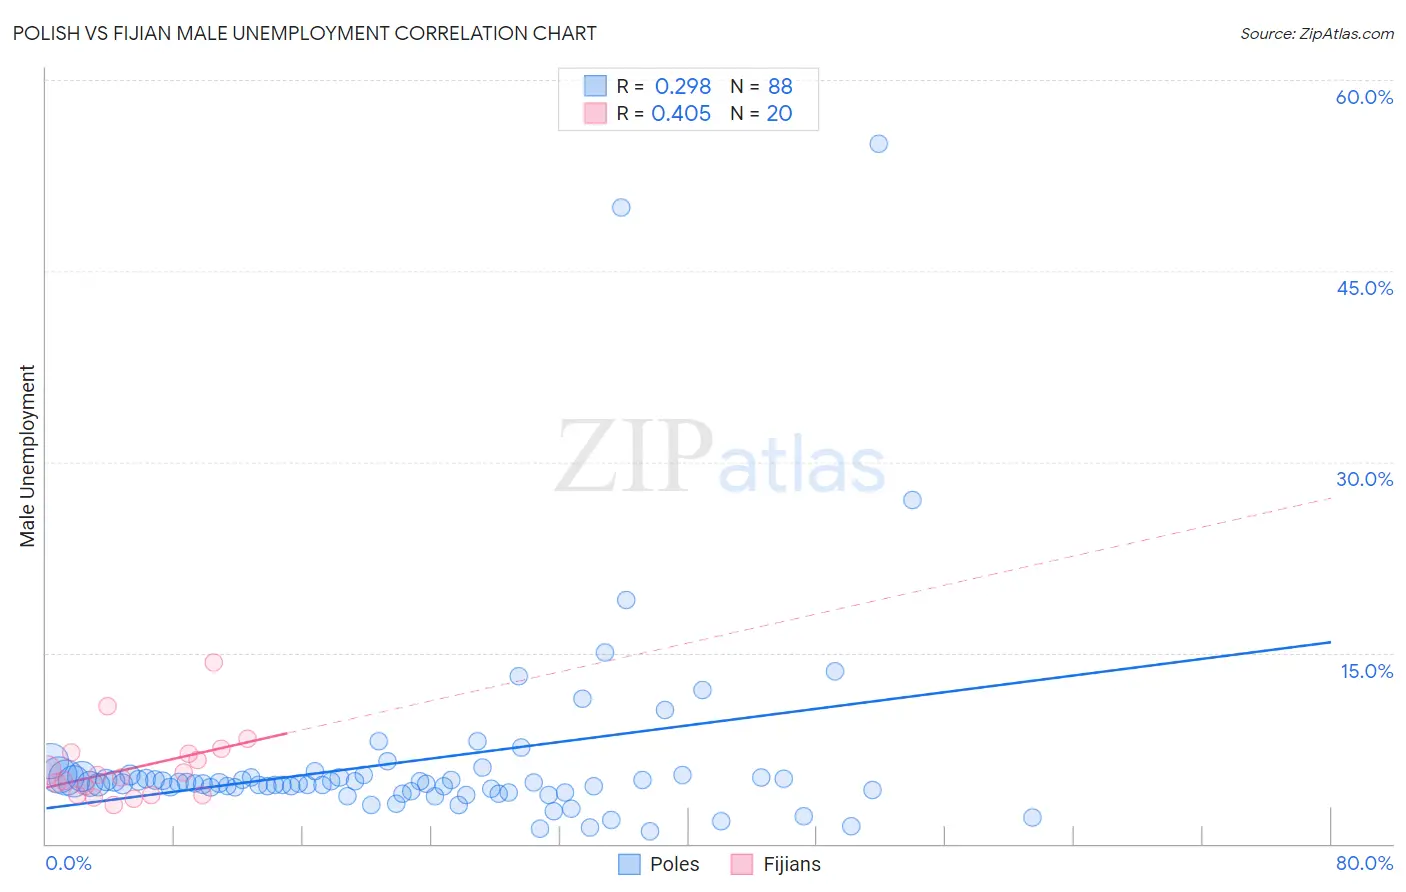
Polish vs Fijian Male Unemployment Correlation Chart
The statistical analysis conducted on geographies consisting of 550,894,735 people shows a weak positive correlation between the proportion of Poles and unemployment rate among males in the United States with a correlation coefficient (R) of 0.298 and weighted average of 4.9%. Similarly, the statistical analysis conducted on geographies consisting of 55,914,259 people shows a moderate positive correlation between the proportion of Fijians and unemployment rate among males in the United States with a correlation coefficient (R) of 0.405 and weighted average of 5.2%, a difference of 5.0%.
Male Unemployment Correlation Summary
| Measurement | Polish | Fijian |
| Minimum | 1.0% | 3.1% |
| Maximum | 55.0% | 14.2% |
| Range | 54.0% | 11.1% |
| Mean | 6.5% | 6.0% |
| Median | 4.8% | 5.3% |
| Interquartile 25% (IQ1) | 4.1% | 3.8% |
| Interquartile 75% (IQ3) | 5.3% | 7.1% |
| Interquartile Range (IQR) | 1.1% | 3.3% |
| Standard Deviation (Sample) | 8.0% | 2.7% |
| Standard Deviation (Population) | 7.9% | 2.7% |
Similar Demographics by Male Unemployment
Demographics Similar to Poles by Male Unemployment
In terms of male unemployment, the demographic groups most similar to Poles are Immigrants from Scotland (4.9%, a difference of 0.010%), Croatian (4.9%, a difference of 0.010%), Austrian (4.9%, a difference of 0.030%), Slovene (5.0%, a difference of 0.040%), and Irish (5.0%, a difference of 0.060%).
| Demographics | Rating | Rank | Male Unemployment |
| Immigrants | Belgium | 99.2 /100 | #42 | Exceptional 4.9% |
| Immigrants | Japan | 99.2 /100 | #43 | Exceptional 4.9% |
| Immigrants | Korea | 99.1 /100 | #44 | Exceptional 4.9% |
| Immigrants | Zimbabwe | 99.0 /100 | #45 | Exceptional 4.9% |
| Bhutanese | 98.9 /100 | #46 | Exceptional 4.9% |
| Austrians | 98.9 /100 | #47 | Exceptional 4.9% |
| Immigrants | Scotland | 98.9 /100 | #48 | Exceptional 4.9% |
| Poles | 98.9 /100 | #49 | Exceptional 4.9% |
| Croatians | 98.9 /100 | #50 | Exceptional 4.9% |
| Slovenes | 98.8 /100 | #51 | Exceptional 5.0% |
| Irish | 98.8 /100 | #52 | Exceptional 5.0% |
| Jordanians | 98.8 /100 | #53 | Exceptional 5.0% |
| Yugoslavians | 98.7 /100 | #54 | Exceptional 5.0% |
| Czechoslovakians | 98.7 /100 | #55 | Exceptional 5.0% |
| Immigrants | Bulgaria | 98.7 /100 | #56 | Exceptional 5.0% |
Demographics Similar to Fijians by Male Unemployment
In terms of male unemployment, the demographic groups most similar to Fijians are Syrian (5.2%, a difference of 0.030%), Sri Lankan (5.2%, a difference of 0.030%), Macedonian (5.2%, a difference of 0.050%), Immigrants from Kenya (5.2%, a difference of 0.050%), and Immigrants from Burma/Myanmar (5.2%, a difference of 0.070%).
| Demographics | Rating | Rank | Male Unemployment |
| Immigrants | Saudi Arabia | 80.1 /100 | #135 | Excellent 5.2% |
| Lebanese | 79.9 /100 | #136 | Good 5.2% |
| Immigrants | Eastern Africa | 79.8 /100 | #137 | Good 5.2% |
| Immigrants | Croatia | 79.7 /100 | #138 | Good 5.2% |
| Kenyans | 79.4 /100 | #139 | Good 5.2% |
| Brazilians | 79.3 /100 | #140 | Good 5.2% |
| Immigrants | Switzerland | 79.2 /100 | #141 | Good 5.2% |
| Fijians | 78.3 /100 | #142 | Good 5.2% |
| Syrians | 78.0 /100 | #143 | Good 5.2% |
| Sri Lankans | 77.9 /100 | #144 | Good 5.2% |
| Macedonians | 77.7 /100 | #145 | Good 5.2% |
| Immigrants | Kenya | 77.6 /100 | #146 | Good 5.2% |
| Immigrants | Burma/Myanmar | 77.5 /100 | #147 | Good 5.2% |
| Immigrants | Italy | 76.3 /100 | #148 | Good 5.2% |
| Immigrants | Europe | 76.2 /100 | #149 | Good 5.2% |