Pima vs Immigrants from Germany Unemployment Among Ages 16 to 19 years
COMPARE
Pima
Immigrants from Germany
Unemployment Among Ages 16 to 19 years
Unemployment Among Ages 16 to 19 years Comparison
Pima
Immigrants from Germany
23.1%
UNEMPLOYMENT AMONG AGES 16 TO 19 YEARS
0.0/ 100
METRIC RATING
327th/ 347
METRIC RANK
17.2%
UNEMPLOYMENT AMONG AGES 16 TO 19 YEARS
87.7/ 100
METRIC RATING
125th/ 347
METRIC RANK
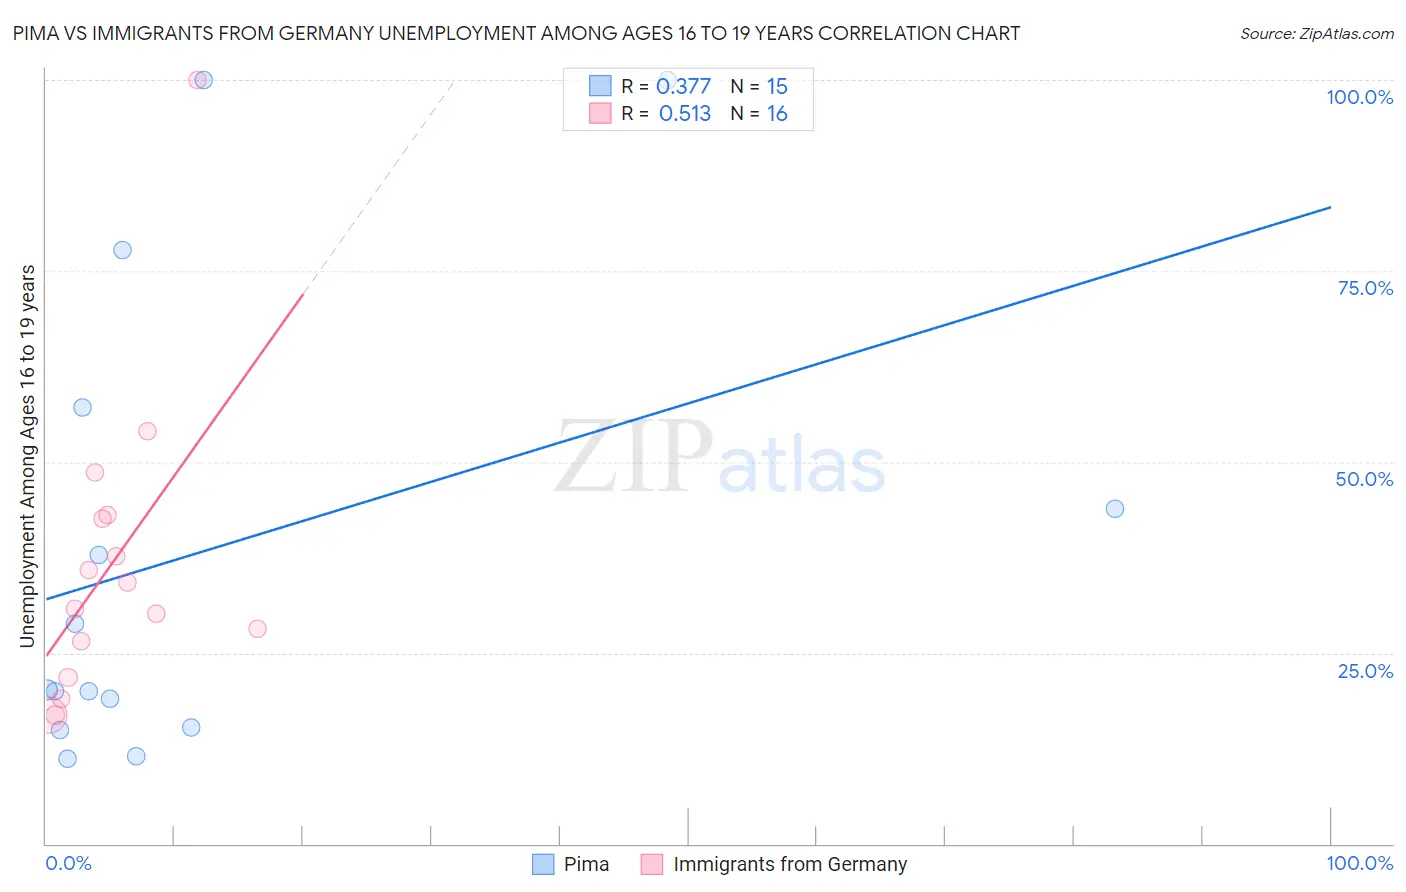
Pima vs Immigrants from Germany Unemployment Among Ages 16 to 19 years Correlation Chart
The statistical analysis conducted on geographies consisting of 60,760,058 people shows a mild positive correlation between the proportion of Pima and unemployment rate among population between the ages 16 and 19 in the United States with a correlation coefficient (R) of 0.377 and weighted average of 23.1%. Similarly, the statistical analysis conducted on geographies consisting of 432,593,145 people shows a substantial positive correlation between the proportion of Immigrants from Germany and unemployment rate among population between the ages 16 and 19 in the United States with a correlation coefficient (R) of 0.513 and weighted average of 17.2%, a difference of 34.8%.
Unemployment Among Ages 16 to 19 years Correlation Summary
| Measurement | Pima | Immigrants from Germany |
| Minimum | 11.1% | 16.9% |
| Maximum | 100.0% | 100.0% |
| Range | 88.9% | 83.1% |
| Mean | 38.5% | 36.6% |
| Median | 20.1% | 32.5% |
| Interquartile 25% (IQ1) | 15.3% | 24.1% |
| Interquartile 75% (IQ3) | 57.1% | 42.8% |
| Interquartile Range (IQR) | 41.8% | 18.7% |
| Standard Deviation (Sample) | 31.1% | 20.2% |
| Standard Deviation (Population) | 30.1% | 19.5% |
Similar Demographics by Unemployment Among Ages 16 to 19 years
Demographics Similar to Pima by Unemployment Among Ages 16 to 19 years
In terms of unemployment among ages 16 to 19 years, the demographic groups most similar to Pima are Immigrants from Trinidad and Tobago (23.1%, a difference of 0.26%), Immigrants from Dominican Republic (23.3%, a difference of 0.66%), Tlingit-Haida (23.5%, a difference of 1.7%), Dominican (23.6%, a difference of 2.2%), and Trinidadian and Tobagonian (22.6%, a difference of 2.3%).
| Demographics | Rating | Rank | Unemployment Among Ages 16 to 19 years |
| Cheyenne | 0.0 /100 | #320 | Tragic 22.3% |
| West Indians | 0.0 /100 | #321 | Tragic 22.4% |
| Barbadians | 0.0 /100 | #322 | Tragic 22.5% |
| Yakama | 0.0 /100 | #323 | Tragic 22.5% |
| Immigrants | Armenia | 0.0 /100 | #324 | Tragic 22.6% |
| Trinidadians and Tobagonians | 0.0 /100 | #325 | Tragic 22.6% |
| Immigrants | Trinidad and Tobago | 0.0 /100 | #326 | Tragic 23.1% |
| Pima | 0.0 /100 | #327 | Tragic 23.1% |
| Immigrants | Dominican Republic | 0.0 /100 | #328 | Tragic 23.3% |
| Tlingit-Haida | 0.0 /100 | #329 | Tragic 23.5% |
| Dominicans | 0.0 /100 | #330 | Tragic 23.6% |
| British West Indians | 0.0 /100 | #331 | Tragic 24.0% |
| Immigrants | Barbados | 0.0 /100 | #332 | Tragic 24.0% |
| Paiute | 0.0 /100 | #333 | Tragic 24.4% |
| Guyanese | 0.0 /100 | #334 | Tragic 24.8% |
Demographics Similar to Immigrants from Germany by Unemployment Among Ages 16 to 19 years
In terms of unemployment among ages 16 to 19 years, the demographic groups most similar to Immigrants from Germany are Immigrants from Bolivia (17.2%, a difference of 0.10%), Syrian (17.1%, a difference of 0.11%), Immigrants from Laos (17.1%, a difference of 0.13%), Pakistani (17.2%, a difference of 0.20%), and Australian (17.2%, a difference of 0.22%).
| Demographics | Rating | Rank | Unemployment Among Ages 16 to 19 years |
| Venezuelans | 91.8 /100 | #118 | Exceptional 17.1% |
| Hungarians | 91.6 /100 | #119 | Exceptional 17.1% |
| Immigrants | Middle Africa | 90.9 /100 | #120 | Exceptional 17.1% |
| Immigrants | Moldova | 90.7 /100 | #121 | Exceptional 17.1% |
| Immigrants | South Eastern Asia | 90.7 /100 | #122 | Exceptional 17.1% |
| Immigrants | Laos | 88.8 /100 | #123 | Excellent 17.1% |
| Syrians | 88.6 /100 | #124 | Excellent 17.1% |
| Immigrants | Germany | 87.7 /100 | #125 | Excellent 17.2% |
| Immigrants | Bolivia | 86.7 /100 | #126 | Excellent 17.2% |
| Pakistanis | 85.8 /100 | #127 | Excellent 17.2% |
| Australians | 85.6 /100 | #128 | Excellent 17.2% |
| Creek | 85.5 /100 | #129 | Excellent 17.2% |
| Immigrants | Indonesia | 84.7 /100 | #130 | Excellent 17.2% |
| German Russians | 84.1 /100 | #131 | Excellent 17.2% |
| Arabs | 83.9 /100 | #132 | Excellent 17.2% |