Pima vs Immigrants from the Azores Female Unemployment
COMPARE
Pima
Immigrants from the Azores
Female Unemployment
Female Unemployment Comparison
Pima
Immigrants from the Azores
9.3%
FEMALE UNEMPLOYMENT
0.0/ 100
METRIC RATING
344th/ 347
METRIC RANK
5.8%
FEMALE UNEMPLOYMENT
0.1/ 100
METRIC RATING
263rd/ 347
METRIC RANK
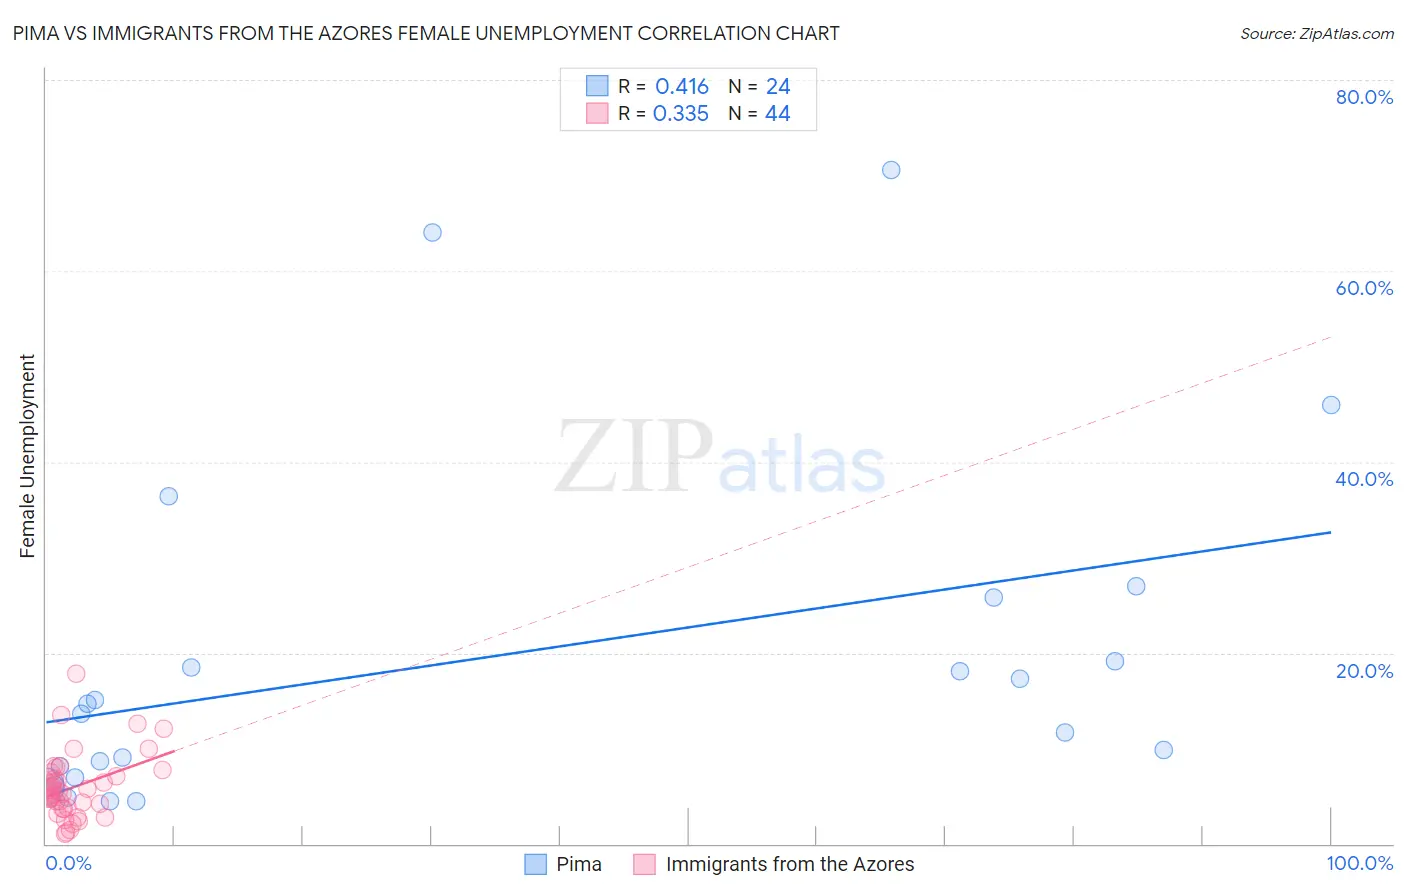
Pima vs Immigrants from the Azores Female Unemployment Correlation Chart
The statistical analysis conducted on geographies consisting of 61,489,621 people shows a moderate positive correlation between the proportion of Pima and unemploymnet rate among females in the United States with a correlation coefficient (R) of 0.416 and weighted average of 9.3%. Similarly, the statistical analysis conducted on geographies consisting of 46,148,620 people shows a mild positive correlation between the proportion of Immigrants from the Azores and unemploymnet rate among females in the United States with a correlation coefficient (R) of 0.335 and weighted average of 5.8%, a difference of 60.4%.
Female Unemployment Correlation Summary
| Measurement | Pima | Immigrants from the Azores |
| Minimum | 4.5% | 1.0% |
| Maximum | 70.6% | 17.8% |
| Range | 66.1% | 16.8% |
| Mean | 19.4% | 5.9% |
| Median | 14.2% | 5.4% |
| Interquartile 25% (IQ1) | 7.5% | 3.7% |
| Interquartile 75% (IQ3) | 22.5% | 7.3% |
| Interquartile Range (IQR) | 14.9% | 3.6% |
| Standard Deviation (Sample) | 18.0% | 3.4% |
| Standard Deviation (Population) | 17.6% | 3.4% |
Similar Demographics by Female Unemployment
Demographics Similar to Pima by Female Unemployment
In terms of female unemployment, the demographic groups most similar to Pima are Yuman (9.6%, a difference of 2.8%), Arapaho (8.8%, a difference of 6.2%), Puerto Rican (8.3%, a difference of 11.9%), Inupiat (8.2%, a difference of 14.4%), and Hopi (8.1%, a difference of 15.3%).
| Demographics | Rating | Rank | Female Unemployment |
| Menominee | 0.0 /100 | #333 | Tragic 7.0% |
| Immigrants | Armenia | 0.0 /100 | #334 | Tragic 7.1% |
| Dominicans | 0.0 /100 | #335 | Tragic 7.2% |
| Immigrants | Dominican Republic | 0.0 /100 | #336 | Tragic 7.2% |
| Navajo | 0.0 /100 | #337 | Tragic 7.3% |
| Tohono O'odham | 0.0 /100 | #338 | Tragic 7.7% |
| Immigrants | Yemen | 0.0 /100 | #339 | Tragic 7.8% |
| Hopi | 0.0 /100 | #340 | Tragic 8.1% |
| Inupiat | 0.0 /100 | #341 | Tragic 8.2% |
| Puerto Ricans | 0.0 /100 | #342 | Tragic 8.3% |
| Arapaho | 0.0 /100 | #343 | Tragic 8.8% |
| Pima | 0.0 /100 | #344 | Tragic 9.3% |
| Yuman | 0.0 /100 | #345 | Tragic 9.6% |
| Yup'ik | 0.0 /100 | #346 | Tragic 10.9% |
| Crow | 0.0 /100 | #347 | Tragic 12.1% |
Demographics Similar to Immigrants from the Azores by Female Unemployment
In terms of female unemployment, the demographic groups most similar to Immigrants from the Azores are Immigrants from Bahamas (5.8%, a difference of 0.39%), Immigrants from Nigeria (5.8%, a difference of 0.67%), Kiowa (5.8%, a difference of 0.71%), Blackfeet (5.9%, a difference of 0.79%), and Nigerian (5.8%, a difference of 0.97%).
| Demographics | Rating | Rank | Female Unemployment |
| Sub-Saharan Africans | 0.4 /100 | #256 | Tragic 5.7% |
| Dutch West Indians | 0.3 /100 | #257 | Tragic 5.7% |
| Immigrants | Portugal | 0.2 /100 | #258 | Tragic 5.8% |
| Immigrants | Fiji | 0.2 /100 | #259 | Tragic 5.8% |
| Nigerians | 0.2 /100 | #260 | Tragic 5.8% |
| Kiowa | 0.1 /100 | #261 | Tragic 5.8% |
| Immigrants | Nigeria | 0.1 /100 | #262 | Tragic 5.8% |
| Immigrants | Azores | 0.1 /100 | #263 | Tragic 5.8% |
| Immigrants | Bahamas | 0.1 /100 | #264 | Tragic 5.8% |
| Blackfeet | 0.0 /100 | #265 | Tragic 5.9% |
| Cape Verdeans | 0.0 /100 | #266 | Tragic 5.9% |
| Nepalese | 0.0 /100 | #267 | Tragic 5.9% |
| Hondurans | 0.0 /100 | #268 | Tragic 5.9% |
| Immigrants | Western Africa | 0.0 /100 | #269 | Tragic 5.9% |
| Immigrants | Honduras | 0.0 /100 | #270 | Tragic 5.9% |