Pima vs Immigrants from Albania Unemployment Among Youth under 25 years

COMPARE

Pima
Race
Ancestry
AfghanAfricanAlaska NativeAlaskan AthabascanAlbanianAleutAlsatianAmericanApacheArabArapahoArgentineanArmenianAssyrian/Chaldean/SyriacAustralianAustrianBahamianBangladeshiBarbadianBasqueBelgianBelizeanBermudanBhutaneseBlackfeetBolivianBrazilianBritishBritish West IndianBulgarianBurmeseCajunCambodianCanadianCape VerdeanCarpatho RusynCelticCentral AmericanCentral American IndianCherokeeCheyenneChickasawChileanChineseChippewaChoctawColombianColvilleComancheCosta RicanCreeCreekCroatianCrowCubanCypriotCzechCzechoslovakianDanishDelawareDominicanDutchDutch West IndianEastern EuropeanEcuadorianEgyptianEnglishEstonianEthiopianEuropeanFijianFilipinoFinnishFrenchFrench American IndianFrench CanadianGermanGerman RussianGhanaianGreekGuamanian/ChamorroGuatemalanGuyaneseHaitianHmongHonduranHopiHoumaHungarianIcelanderIndian (Asian)IndonesianInupiatIranianIraqiIrishIroquoisIsraeliItalianJamaicanJapaneseJordanianKenyanKiowaKoreanLaotianLatvianLebaneseLiberianLithuanianLumbeeLuxembourgerMacedonianMalaysianMalteseMarshalleseMenomineeMexicanMexican American IndianMongolianMoroccanNative HawaiianNavajoNepaleseNew ZealanderNicaraguanNigerianNorthern EuropeanNorwegianOkinawanOsageOttawaPaiutePakistaniPalestinianPanamanianParaguayanPennsylvania GermanPeruvianPimaPolishPortuguesePotawatomiPuebloPuerto RicanPuget Sound SalishRomanianRussianSalvadoranSamoanScandinavianScotch-IrishScottishSeminoleSenegaleseSerbianShoshoneSierra LeoneanSiouxSlavicSlovakSloveneSomaliSouth AfricanSouth AmericanSouth American IndianSoviet UnionSpaniardSpanishSpanish AmericanSpanish American IndianSri LankanSubsaharan AfricanSudaneseSwedishSwissSyrianTaiwaneseThaiTlingit-HaidaTohono O'OdhamTonganTrinidadian and TobagonianTsimshianTurkishU.S. Virgin IslanderUgandanUkrainianUruguayanUteVenezuelanVietnameseWelshWest IndianYakamaYaquiYugoslavianYumanYup'ikZimbabwean
Immigration
NonimmigrantsImmigrantsAfghanistanAfricaArgentinaArmeniaAsiaAustraliaAustriaBahamasBangladeshBarbadosBelarusBelgiumBelizeBoliviaBosnia and HerzegovinaBrazilBulgariaBurma/MyanmarCabo VerdeCambodiaCameroonCanadaCaribbeanCentral AmericaChileChinaColombiaCongoCosta RicaCroatiaCubaCzechoslovakiaDenmarkDominicaDominican RepublicEastern AfricaEastern AsiaEastern EuropeEcuadorEgyptEl SalvadorEnglandEritreaEthiopiaEuropeFijiFranceGermanyGhanaGreeceGrenadaGuatemalaGuyanaHaitiHondurasHong KongHungaryIndiaIndonesiaIranIraqIrelandIsraelItalyJamaicaJapanJordanKazakhstanKenyaKoreaKuwaitLaosLatin AmericaLatviaLebanonLiberiaLithuaniaMalaysiaMexicoMicronesiaMiddle AfricaMoldovaMoroccoNepalNetherlandsNicaraguaNigeriaNorth AmericaNorth MacedoniaNorthern AfricaNorthern EuropeNorwayOceaniaPakistanPanamaPeruPhilippinesPolandPortugalRomaniaRussiaSaudi ArabiaScotlandSenegalSerbiaSierra LeoneSingaporeSomaliaSouth AfricaSouth AmericaSouth Central AsiaSouth Eastern AsiaSouthern EuropeSpainSri LankaSt. Vincent and the GrenadinesSudanSwedenSwitzerlandSyriaTaiwanThailandTrinidad and TobagoTurkeyUgandaUkraineUruguayUzbekistanVenezuelaVietnamWest IndiesWestern AfricaWestern AsiaWestern EuropeYemenZaireZimbabweAzores
Immigrants from Albania
Race
Ancestry
AfghanAfricanAlaska NativeAlaskan AthabascanAlbanianAleutAlsatianAmericanApacheArabArapahoArgentineanArmenianAssyrian/Chaldean/SyriacAustralianAustrianBahamianBangladeshiBarbadianBasqueBelgianBelizeanBermudanBhutaneseBlackfeetBolivianBrazilianBritishBritish West IndianBulgarianBurmeseCajunCambodianCanadianCape VerdeanCarpatho RusynCelticCentral AmericanCentral American IndianCherokeeCheyenneChickasawChileanChineseChippewaChoctawColombianColvilleComancheCosta RicanCreeCreekCroatianCrowCubanCypriotCzechCzechoslovakianDanishDelawareDominicanDutchDutch West IndianEastern EuropeanEcuadorianEgyptianEnglishEstonianEthiopianEuropeanFijianFilipinoFinnishFrenchFrench American IndianFrench CanadianGermanGerman RussianGhanaianGreekGuamanian/ChamorroGuatemalanGuyaneseHaitianHmongHonduranHopiHoumaHungarianIcelanderIndian (Asian)IndonesianInupiatIranianIraqiIrishIroquoisIsraeliItalianJamaicanJapaneseJordanianKenyanKiowaKoreanLaotianLatvianLebaneseLiberianLithuanianLumbeeLuxembourgerMacedonianMalaysianMalteseMarshalleseMenomineeMexicanMexican American IndianMongolianMoroccanNative HawaiianNavajoNepaleseNew ZealanderNicaraguanNigerianNorthern EuropeanNorwegianOkinawanOsageOttawaPaiutePakistaniPalestinianPanamanianParaguayanPennsylvania GermanPeruvianPolishPortuguesePotawatomiPuebloPuerto RicanPuget Sound SalishRomanianRussianSalvadoranSamoanScandinavianScotch-IrishScottishSeminoleSenegaleseSerbianShoshoneSierra LeoneanSiouxSlavicSlovakSloveneSomaliSouth AfricanSouth AmericanSouth American IndianSoviet UnionSpaniardSpanishSpanish AmericanSpanish American IndianSri LankanSubsaharan AfricanSudaneseSwedishSwissSyrianTaiwaneseThaiTlingit-HaidaTohono O'OdhamTonganTrinidadian and TobagonianTsimshianTurkishU.S. Virgin IslanderUgandanUkrainianUruguayanUteVenezuelanVietnameseWelshWest IndianYakamaYaquiYugoslavianYumanYup'ikZimbabwean
Immigration
NonimmigrantsImmigrantsAfghanistanAfricaAlbaniaArgentinaArmeniaAsiaAustraliaAustriaBahamasBangladeshBarbadosBelarusBelgiumBelizeBoliviaBosnia and HerzegovinaBrazilBulgariaBurma/MyanmarCabo VerdeCambodiaCameroonCanadaCaribbeanCentral AmericaChileChinaColombiaCongoCosta RicaCroatiaCubaCzechoslovakiaDenmarkDominicaDominican RepublicEastern AfricaEastern AsiaEastern EuropeEcuadorEgyptEl SalvadorEnglandEritreaEthiopiaEuropeFijiFranceGermanyGhanaGreeceGrenadaGuatemalaGuyanaHaitiHondurasHong KongHungaryIndiaIndonesiaIranIraqIrelandIsraelItalyJamaicaJapanJordanKazakhstanKenyaKoreaKuwaitLaosLatin AmericaLatviaLebanonLiberiaLithuaniaMalaysiaMexicoMicronesiaMiddle AfricaMoldovaMoroccoNepalNetherlandsNicaraguaNigeriaNorth AmericaNorth MacedoniaNorthern AfricaNorthern EuropeNorwayOceaniaPakistanPanamaPeruPhilippinesPolandPortugalRomaniaRussiaSaudi ArabiaScotlandSenegalSerbiaSierra LeoneSingaporeSomaliaSouth AfricaSouth AmericaSouth Central AsiaSouth Eastern AsiaSouthern EuropeSpainSri LankaSt. Vincent and the GrenadinesSudanSwedenSwitzerlandSyriaTaiwanThailandTrinidad and TobagoTurkeyUgandaUkraineUruguayUzbekistanVenezuelaVietnamWest IndiesWestern AfricaWestern AsiaWestern EuropeYemenZaireZimbabweAzores
Unemployment Among Youth under 25 years
Income
Poverty
Unemployment
Labor Participation
Family Structure
Vehicle Availability
Education Level
Disability

Unemployment Among Youth under 25 years Comparison

Pima

Immigrants from Albania

Tragic
Tragic
16.2%
UNEMPLOYMENT AMONG YOUTH UNDER 25 YEARS
0.0/ 100
METRIC RATING
336th/ 347
METRIC RANK
12.1%
UNEMPLOYMENT AMONG YOUTH UNDER 25 YEARS
1.1/ 100
METRIC RATING
241st/ 347
METRIC RANK

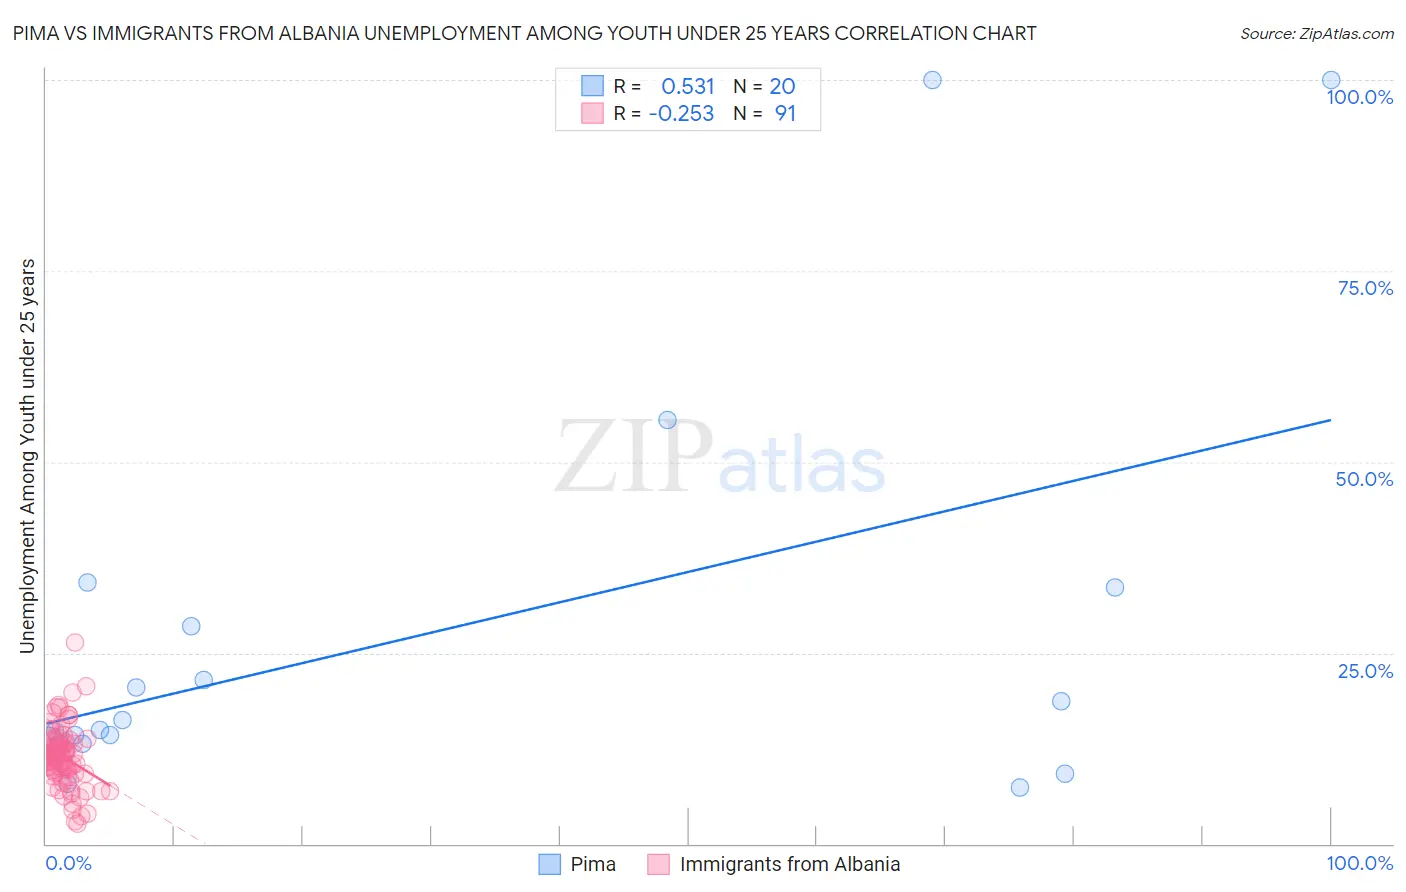
Pima vs Immigrants from Albania Unemployment Among Youth under 25 years Correlation Chart

The statistical analysis conducted on geographies consisting of 61,326,088 people shows a substantial positive correlation between the proportion of Pima and unemployment rate among youth under the age of 25 in the United States with a correlation coefficient (R) of 0.531 and weighted average of 16.2%. Similarly, the statistical analysis conducted on geographies consisting of 118,834,008 people shows a weak negative correlation between the proportion of Immigrants from Albania and unemployment rate among youth under the age of 25 in the United States with a correlation coefficient (R) of -0.253 and weighted average of 12.1%, a difference of 33.8%.
Pima vs Immigrants from Albania Unemployment Among Youth under 25 years

Unemployment Among Youth under 25 years Correlation Summary

MeasurementPimaImmigrants from Albania
Minimum7.3%2.7%
Maximum100.0%26.4%
Range92.7%23.7%
Mean27.5%11.4%
Median15.5%11.5%
Interquartile 25% (IQ1)13.1%9.3%
Interquartile 75% (IQ3)30.9%13.2%
Interquartile Range (IQR)17.9%3.9%
Standard Deviation (Sample)27.2%3.9%
Standard Deviation (Population)26.6%3.9%

Similar Demographics by Unemployment Among Youth under 25 years

Demographics Similar to Pima by Unemployment Among Youth under 25 years

In terms of unemployment among youth under 25 years, the demographic groups most similar to Pima are Arapaho (16.3%, a difference of 0.16%), Yuman (16.3%, a difference of 0.45%), Immigrants from St. Vincent and the Grenadines (16.1%, a difference of 0.64%), Tsimshian (16.5%, a difference of 1.5%), and Immigrants from Guyana (15.9%, a difference of 1.9%).
DemographicsRating | RankUnemployment Among Youth under 25 years
Immigrants | Yemen
0.0
/100
|
#329
Tragic
15.6%
Yakama
0.0
/100
|
#330
Tragic
15.6%
Dominicans
0.0
/100
|
#331
Tragic
15.7%
Immigrants | Grenada
0.0
/100
|
#332
Tragic
15.8%
Guyanese
0.0
/100
|
#333
Tragic
15.9%
Immigrants | Guyana
0.0
/100
|
#334
Tragic
15.9%
Immigrants | St. Vincent and the Grenadines
0.0
/100
|
#335
Tragic
16.1%
Pima
0.0
/100
|
#336
Tragic
16.2%
Arapaho
0.0
/100
|
#337
Tragic
16.3%
Yuman
0.0
/100
|
#338
Tragic
16.3%
Tsimshian
0.0
/100
|
#339
Tragic
16.5%
Colville
0.0
/100
|
#340
Tragic
16.8%
Paiute
0.0
/100
|
#341
Tragic
17.6%
Puerto Ricans
0.0
/100
|
#342
Tragic
18.4%
Navajo
0.0
/100
|
#343
Tragic
18.6%

Demographics Similar to Immigrants from Albania by Unemployment Among Youth under 25 years

In terms of unemployment among youth under 25 years, the demographic groups most similar to Immigrants from Albania are Dutch West Indian (12.1%, a difference of 0.020%), Immigrants from Africa (12.1%, a difference of 0.050%), Albanian (12.1%, a difference of 0.10%), Native Hawaiian (12.1%, a difference of 0.17%), and Immigrants (12.1%, a difference of 0.19%).
DemographicsRating | RankUnemployment Among Youth under 25 years
Guatemalans
1.4
/100
|
#234
Tragic
12.1%
Immigrants | Guatemala
1.4
/100
|
#235
Tragic
12.1%
Immigrants | Immigrants
1.3
/100
|
#236
Tragic
12.1%
Native Hawaiians
1.3
/100
|
#237
Tragic
12.1%
Albanians
1.2
/100
|
#238
Tragic
12.1%
Immigrants | Africa
1.1
/100
|
#239
Tragic
12.1%
Dutch West Indians
1.1
/100
|
#240
Tragic
12.1%
Immigrants | Albania
1.1
/100
|
#241
Tragic
12.1%
Immigrants | Western Asia
0.8
/100
|
#242
Tragic
12.2%
Immigrants | Azores
0.6
/100
|
#243
Tragic
12.2%
Alaskan Athabascans
0.6
/100
|
#244
Tragic
12.2%
Spanish Americans
0.6
/100
|
#245
Tragic
12.2%
Immigrants | Honduras
0.6
/100
|
#246
Tragic
12.2%
Immigrants | Greece
0.6
/100
|
#247
Tragic
12.2%
Central Americans
0.6
/100
|
#248
Tragic
12.2%