Pennsylvania German vs Immigrants from Austria Unemployment Among Women with Children Ages 6 to 17 years
COMPARE
Pennsylvania German
Immigrants from Austria
Unemployment Among Women with Children Ages 6 to 17 years
Unemployment Among Women with Children Ages 6 to 17 years Comparison
Pennsylvania Germans
Immigrants from Austria
11.0%
UNEMPLOYMENT AMONG WOMEN WITH CHILDREN AGES 6 TO 17 YEARS
0.0/ 100
METRIC RATING
329th/ 347
METRIC RANK
8.8%
UNEMPLOYMENT AMONG WOMEN WITH CHILDREN AGES 6 TO 17 YEARS
87.5/ 100
METRIC RATING
142nd/ 347
METRIC RANK
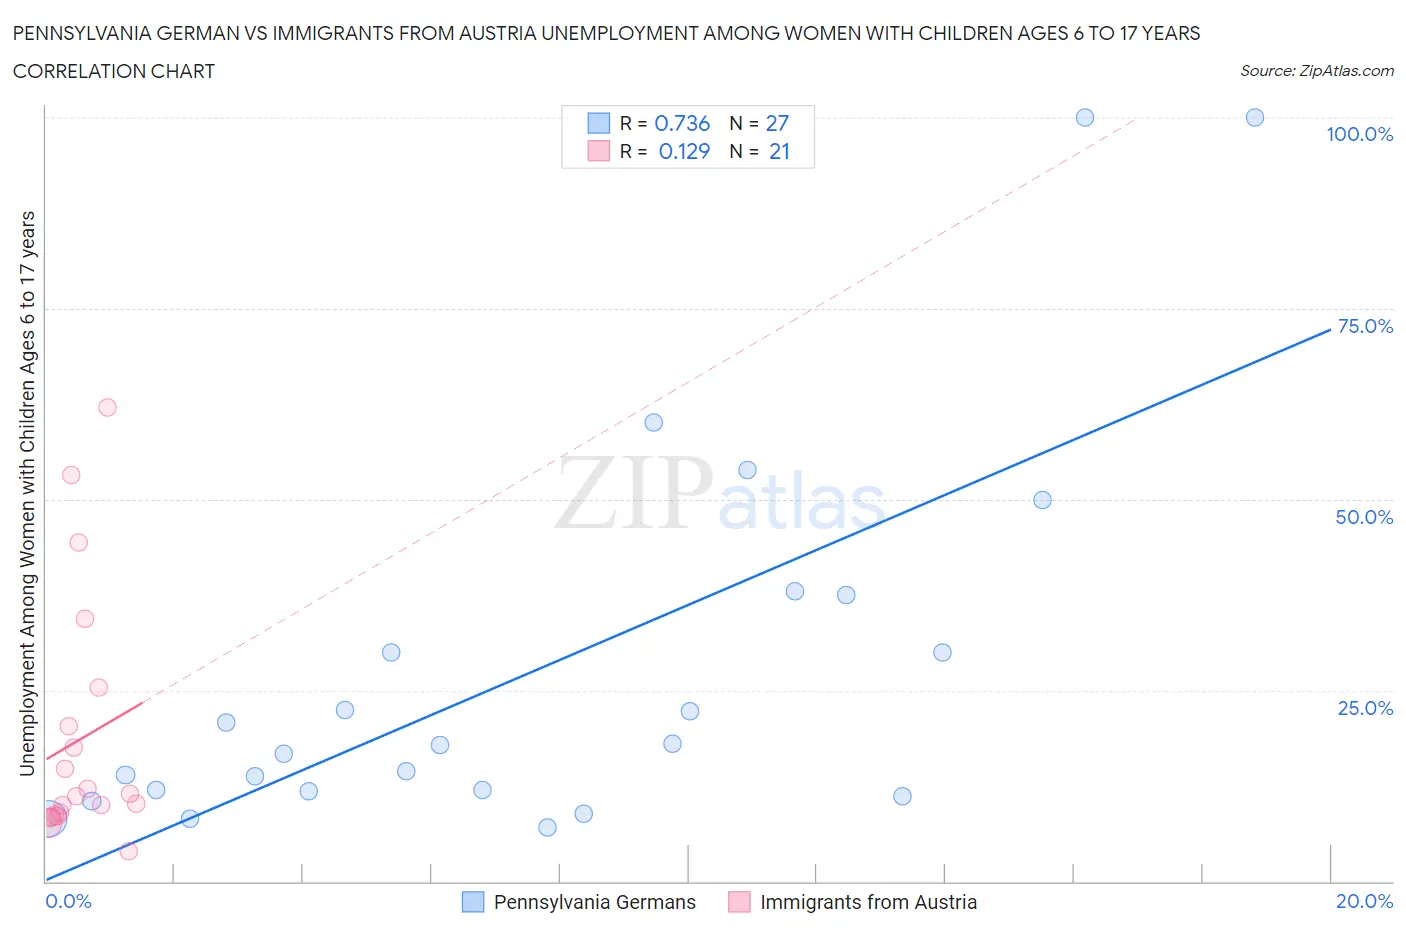
Pennsylvania German vs Immigrants from Austria Unemployment Among Women with Children Ages 6 to 17 years Correlation Chart
The statistical analysis conducted on geographies consisting of 176,093,273 people shows a strong positive correlation between the proportion of Pennsylvania Germans and unemployment rate among women with children between the ages 6 and 17 in the United States with a correlation coefficient (R) of 0.736 and weighted average of 11.0%. Similarly, the statistical analysis conducted on geographies consisting of 134,337,989 people shows a poor positive correlation between the proportion of Immigrants from Austria and unemployment rate among women with children between the ages 6 and 17 in the United States with a correlation coefficient (R) of 0.129 and weighted average of 8.8%, a difference of 25.8%.
Unemployment Among Women with Children Ages 6 to 17 years Correlation Summary
| Measurement | Pennsylvania German | Immigrants from Austria |
| Minimum | 7.1% | 4.0% |
| Maximum | 100.0% | 62.0% |
| Range | 92.9% | 58.0% |
| Mean | 27.7% | 18.6% |
| Median | 17.9% | 11.2% |
| Interquartile 25% (IQ1) | 11.7% | 8.6% |
| Interquartile 75% (IQ3) | 37.5% | 22.8% |
| Interquartile Range (IQR) | 25.8% | 14.2% |
| Standard Deviation (Sample) | 25.4% | 16.2% |
| Standard Deviation (Population) | 24.9% | 15.8% |
Similar Demographics by Unemployment Among Women with Children Ages 6 to 17 years
Demographics Similar to Pennsylvania Germans by Unemployment Among Women with Children Ages 6 to 17 years
In terms of unemployment among women with children ages 6 to 17 years, the demographic groups most similar to Pennsylvania Germans are Chippewa (11.1%, a difference of 0.48%), Ottawa (10.9%, a difference of 1.5%), Cape Verdean (10.9%, a difference of 1.6%), Liberian (10.8%, a difference of 1.7%), and Cajun (10.8%, a difference of 1.8%).
| Demographics | Rating | Rank | Unemployment Among Women with Children Ages 6 to 17 years |
| Cree | 0.0 /100 | #322 | Tragic 10.8% |
| Dominicans | 0.0 /100 | #323 | Tragic 10.8% |
| Immigrants | Dominican Republic | 0.0 /100 | #324 | Tragic 10.8% |
| Cajuns | 0.0 /100 | #325 | Tragic 10.8% |
| Liberians | 0.0 /100 | #326 | Tragic 10.8% |
| Cape Verdeans | 0.0 /100 | #327 | Tragic 10.9% |
| Ottawa | 0.0 /100 | #328 | Tragic 10.9% |
| Pennsylvania Germans | 0.0 /100 | #329 | Tragic 11.0% |
| Chippewa | 0.0 /100 | #330 | Tragic 11.1% |
| Blacks/African Americans | 0.0 /100 | #331 | Tragic 11.4% |
| Tsimshian | 0.0 /100 | #332 | Tragic 11.4% |
| Natives/Alaskans | 0.0 /100 | #333 | Tragic 11.5% |
| Ugandans | 0.0 /100 | #334 | Tragic 12.0% |
| Colville | 0.0 /100 | #335 | Tragic 12.3% |
| Houma | 0.0 /100 | #336 | Tragic 12.5% |
Demographics Similar to Immigrants from Austria by Unemployment Among Women with Children Ages 6 to 17 years
In terms of unemployment among women with children ages 6 to 17 years, the demographic groups most similar to Immigrants from Austria are Serbian (8.8%, a difference of 0.020%), Immigrants from Poland (8.8%, a difference of 0.080%), Immigrants from Kenya (8.8%, a difference of 0.13%), Russian (8.8%, a difference of 0.16%), and Kenyan (8.8%, a difference of 0.18%).
| Demographics | Rating | Rank | Unemployment Among Women with Children Ages 6 to 17 years |
| Europeans | 90.6 /100 | #135 | Exceptional 8.7% |
| Immigrants | Latvia | 90.4 /100 | #136 | Exceptional 8.7% |
| Immigrants | Argentina | 90.0 /100 | #137 | Excellent 8.7% |
| Immigrants | Ethiopia | 89.5 /100 | #138 | Excellent 8.8% |
| Northern Europeans | 89.2 /100 | #139 | Excellent 8.8% |
| Immigrants | Poland | 88.3 /100 | #140 | Excellent 8.8% |
| Serbians | 87.6 /100 | #141 | Excellent 8.8% |
| Immigrants | Austria | 87.5 /100 | #142 | Excellent 8.8% |
| Immigrants | Kenya | 86.1 /100 | #143 | Excellent 8.8% |
| Russians | 85.8 /100 | #144 | Excellent 8.8% |
| Kenyans | 85.6 /100 | #145 | Excellent 8.8% |
| Chileans | 80.8 /100 | #146 | Excellent 8.8% |
| Immigrants | Bangladesh | 79.4 /100 | #147 | Good 8.8% |
| Costa Ricans | 77.0 /100 | #148 | Good 8.8% |
| Croatians | 76.0 /100 | #149 | Good 8.8% |