Paraguayan vs Shoshone Unemployment
COMPARE
Paraguayan
Shoshone
Unemployment
Unemployment Comparison
Paraguayans
Shoshone
4.9%
UNEMPLOYMENT
98.3/ 100
METRIC RATING
73rd/ 347
METRIC RANK
6.8%
UNEMPLOYMENT
0.0/ 100
METRIC RATING
317th/ 347
METRIC RANK
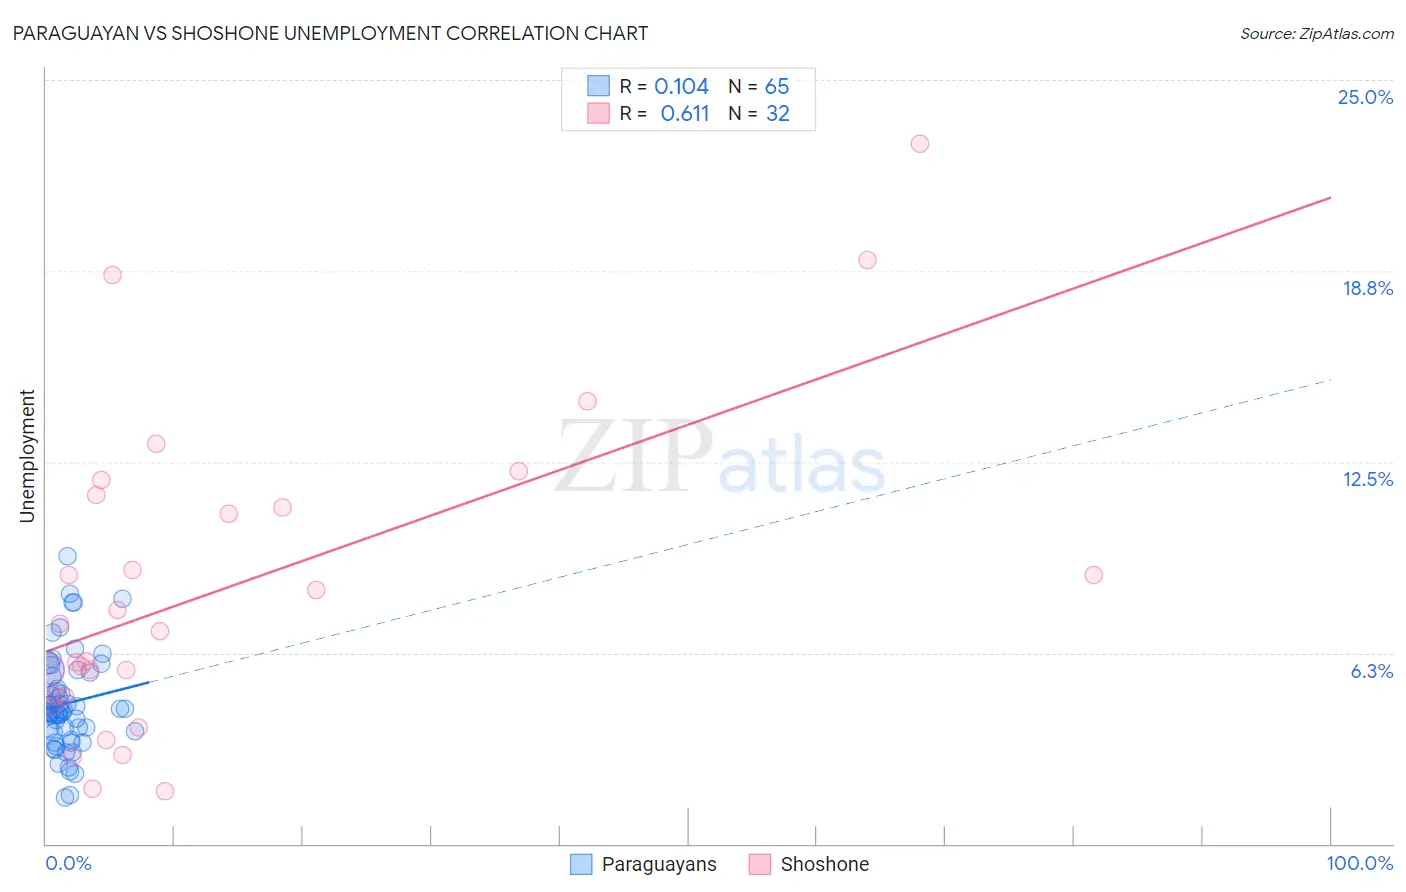
Paraguayan vs Shoshone Unemployment Correlation Chart
The statistical analysis conducted on geographies consisting of 95,099,776 people shows a poor positive correlation between the proportion of Paraguayans and unemployment in the United States with a correlation coefficient (R) of 0.104 and weighted average of 4.9%. Similarly, the statistical analysis conducted on geographies consisting of 66,583,051 people shows a significant positive correlation between the proportion of Shoshone and unemployment in the United States with a correlation coefficient (R) of 0.611 and weighted average of 6.8%, a difference of 37.5%.
Unemployment Correlation Summary
| Measurement | Paraguayan | Shoshone |
| Minimum | 1.5% | 1.7% |
| Maximum | 9.4% | 22.9% |
| Range | 7.9% | 21.2% |
| Mean | 4.6% | 8.4% |
| Median | 4.4% | 7.1% |
| Interquartile 25% (IQ1) | 3.7% | 4.8% |
| Interquartile 75% (IQ3) | 5.5% | 11.2% |
| Interquartile Range (IQR) | 1.9% | 6.4% |
| Standard Deviation (Sample) | 1.6% | 5.1% |
| Standard Deviation (Population) | 1.6% | 5.1% |
Similar Demographics by Unemployment
Demographics Similar to Paraguayans by Unemployment
In terms of unemployment, the demographic groups most similar to Paraguayans are Burmese (4.9%, a difference of 0.040%), Immigrants from Japan (4.9%, a difference of 0.070%), Immigrants from Northern Europe (4.9%, a difference of 0.090%), Serbian (4.9%, a difference of 0.12%), and Turkish (4.9%, a difference of 0.23%).
| Demographics | Rating | Rank | Unemployment |
| Slovaks | 98.7 /100 | #66 | Exceptional 4.9% |
| New Zealanders | 98.6 /100 | #67 | Exceptional 4.9% |
| Slavs | 98.6 /100 | #68 | Exceptional 4.9% |
| Immigrants | North America | 98.5 /100 | #69 | Exceptional 4.9% |
| Serbians | 98.4 /100 | #70 | Exceptional 4.9% |
| Immigrants | Japan | 98.3 /100 | #71 | Exceptional 4.9% |
| Burmese | 98.3 /100 | #72 | Exceptional 4.9% |
| Paraguayans | 98.3 /100 | #73 | Exceptional 4.9% |
| Immigrants | Northern Europe | 98.2 /100 | #74 | Exceptional 4.9% |
| Turks | 98.0 /100 | #75 | Exceptional 4.9% |
| German Russians | 98.0 /100 | #76 | Exceptional 4.9% |
| Cypriots | 97.9 /100 | #77 | Exceptional 4.9% |
| Okinawans | 97.9 /100 | #78 | Exceptional 4.9% |
| Canadians | 97.7 /100 | #79 | Exceptional 5.0% |
| Immigrants | Sweden | 97.6 /100 | #80 | Exceptional 5.0% |
Demographics Similar to Shoshone by Unemployment
In terms of unemployment, the demographic groups most similar to Shoshone are Immigrants from Dominica (6.7%, a difference of 0.58%), Immigrants from Cabo Verde (6.8%, a difference of 0.60%), British West Indian (6.8%, a difference of 0.81%), Houma (6.7%, a difference of 1.4%), and Immigrants from St. Vincent and the Grenadines (6.9%, a difference of 1.6%).
| Demographics | Rating | Rank | Unemployment |
| Immigrants | Belize | 0.0 /100 | #310 | Tragic 6.5% |
| Cape Verdeans | 0.0 /100 | #311 | Tragic 6.5% |
| Colville | 0.0 /100 | #312 | Tragic 6.6% |
| Immigrants | Barbados | 0.0 /100 | #313 | Tragic 6.6% |
| Blacks/African Americans | 0.0 /100 | #314 | Tragic 6.6% |
| Houma | 0.0 /100 | #315 | Tragic 6.7% |
| Immigrants | Dominica | 0.0 /100 | #316 | Tragic 6.7% |
| Shoshone | 0.0 /100 | #317 | Tragic 6.8% |
| Immigrants | Cabo Verde | 0.0 /100 | #318 | Tragic 6.8% |
| British West Indians | 0.0 /100 | #319 | Tragic 6.8% |
| Immigrants | St. Vincent and the Grenadines | 0.0 /100 | #320 | Tragic 6.9% |
| Immigrants | Guyana | 0.0 /100 | #321 | Tragic 6.9% |
| Guyanese | 0.0 /100 | #322 | Tragic 6.9% |
| Immigrants | Grenada | 0.0 /100 | #323 | Tragic 6.9% |
| Immigrants | Armenia | 0.0 /100 | #324 | Tragic 7.0% |