Paraguayan vs Native/Alaskan Male Unemployment
COMPARE
Paraguayan
Native/Alaskan
Male Unemployment
Male Unemployment Comparison
Paraguayans
Natives/Alaskans
4.9%
MALE UNEMPLOYMENT
99.5/ 100
METRIC RATING
35th/ 347
METRIC RANK
7.7%
MALE UNEMPLOYMENT
0.0/ 100
METRIC RATING
328th/ 347
METRIC RANK
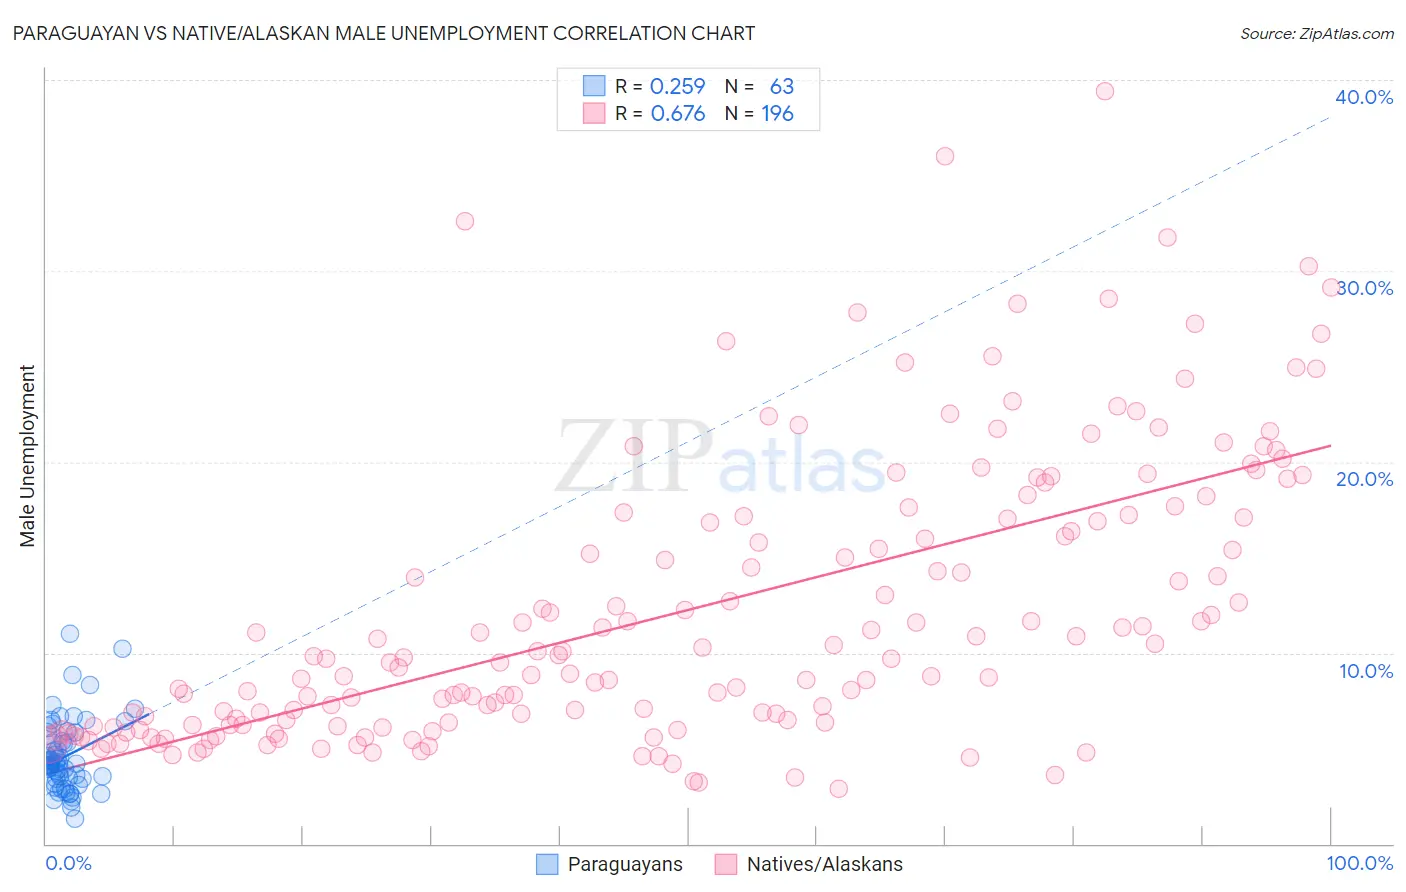
Paraguayan vs Native/Alaskan Male Unemployment Correlation Chart
The statistical analysis conducted on geographies consisting of 95,072,234 people shows a weak positive correlation between the proportion of Paraguayans and unemployment rate among males in the United States with a correlation coefficient (R) of 0.259 and weighted average of 4.9%. Similarly, the statistical analysis conducted on geographies consisting of 507,569,897 people shows a significant positive correlation between the proportion of Natives/Alaskans and unemployment rate among males in the United States with a correlation coefficient (R) of 0.676 and weighted average of 7.7%, a difference of 57.9%.
Male Unemployment Correlation Summary
| Measurement | Paraguayan | Native/Alaskan |
| Minimum | 1.3% | 2.9% |
| Maximum | 11.0% | 39.4% |
| Range | 9.7% | 36.5% |
| Mean | 4.6% | 12.2% |
| Median | 4.2% | 9.7% |
| Interquartile 25% (IQ1) | 3.4% | 6.2% |
| Interquartile 75% (IQ3) | 5.7% | 17.1% |
| Interquartile Range (IQR) | 2.3% | 10.9% |
| Standard Deviation (Sample) | 1.9% | 7.4% |
| Standard Deviation (Population) | 1.9% | 7.4% |
Similar Demographics by Male Unemployment
Demographics Similar to Paraguayans by Male Unemployment
In terms of male unemployment, the demographic groups most similar to Paraguayans are Immigrants from Singapore (4.9%, a difference of 0.080%), Scotch-Irish (4.9%, a difference of 0.29%), Immigrants from Bosnia and Herzegovina (4.9%, a difference of 0.31%), Burmese (4.9%, a difference of 0.38%), and Northern European (4.9%, a difference of 0.46%).
| Demographics | Rating | Rank | Male Unemployment |
| Bulgarians | 99.8 /100 | #28 | Exceptional 4.8% |
| Scottish | 99.8 /100 | #29 | Exceptional 4.8% |
| British | 99.8 /100 | #30 | Exceptional 4.8% |
| Sudanese | 99.8 /100 | #31 | Exceptional 4.8% |
| Immigrants | Nepal | 99.8 /100 | #32 | Exceptional 4.8% |
| Latvians | 99.7 /100 | #33 | Exceptional 4.8% |
| Welsh | 99.7 /100 | #34 | Exceptional 4.8% |
| Paraguayans | 99.5 /100 | #35 | Exceptional 4.9% |
| Immigrants | Singapore | 99.4 /100 | #36 | Exceptional 4.9% |
| Scotch-Irish | 99.4 /100 | #37 | Exceptional 4.9% |
| Immigrants | Bosnia and Herzegovina | 99.4 /100 | #38 | Exceptional 4.9% |
| Burmese | 99.3 /100 | #39 | Exceptional 4.9% |
| Northern Europeans | 99.3 /100 | #40 | Exceptional 4.9% |
| Chinese | 99.3 /100 | #41 | Exceptional 4.9% |
| Immigrants | Belgium | 99.2 /100 | #42 | Exceptional 4.9% |
Demographics Similar to Natives/Alaskans by Male Unemployment
In terms of male unemployment, the demographic groups most similar to Natives/Alaskans are Paiute (7.7%, a difference of 0.38%), Immigrants from Yemen (7.8%, a difference of 0.90%), Immigrants from Dominican Republic (7.6%, a difference of 1.5%), Shoshone (7.6%, a difference of 1.6%), and Dominican (7.6%, a difference of 2.0%).
| Demographics | Rating | Rank | Male Unemployment |
| Immigrants | St. Vincent and the Grenadines | 0.0 /100 | #321 | Tragic 7.5% |
| Immigrants | Cabo Verde | 0.0 /100 | #322 | Tragic 7.5% |
| Immigrants | Grenada | 0.0 /100 | #323 | Tragic 7.6% |
| Dominicans | 0.0 /100 | #324 | Tragic 7.6% |
| Shoshone | 0.0 /100 | #325 | Tragic 7.6% |
| Immigrants | Dominican Republic | 0.0 /100 | #326 | Tragic 7.6% |
| Paiute | 0.0 /100 | #327 | Tragic 7.7% |
| Natives/Alaskans | 0.0 /100 | #328 | Tragic 7.7% |
| Immigrants | Yemen | 0.0 /100 | #329 | Tragic 7.8% |
| Yakama | 0.0 /100 | #330 | Tragic 7.9% |
| Alaska Natives | 0.0 /100 | #331 | Tragic 8.1% |
| Pima | 0.0 /100 | #332 | Tragic 8.3% |
| Sioux | 0.0 /100 | #333 | Tragic 8.4% |
| Tsimshian | 0.0 /100 | #334 | Tragic 8.5% |
| Pueblo | 0.0 /100 | #335 | Tragic 8.5% |