Panamanian vs Salvadoran Unemployment Among Youth under 25 years
COMPARE
Panamanian
Salvadoran
Unemployment Among Youth under 25 years
Unemployment Among Youth under 25 years Comparison
Panamanians
Salvadorans
12.4%
UNEMPLOYMENT AMONG YOUTH UNDER 25 YEARS
0.2/ 100
METRIC RATING
257th/ 347
METRIC RANK
12.4%
UNEMPLOYMENT AMONG YOUTH UNDER 25 YEARS
0.1/ 100
METRIC RATING
258th/ 347
METRIC RANK
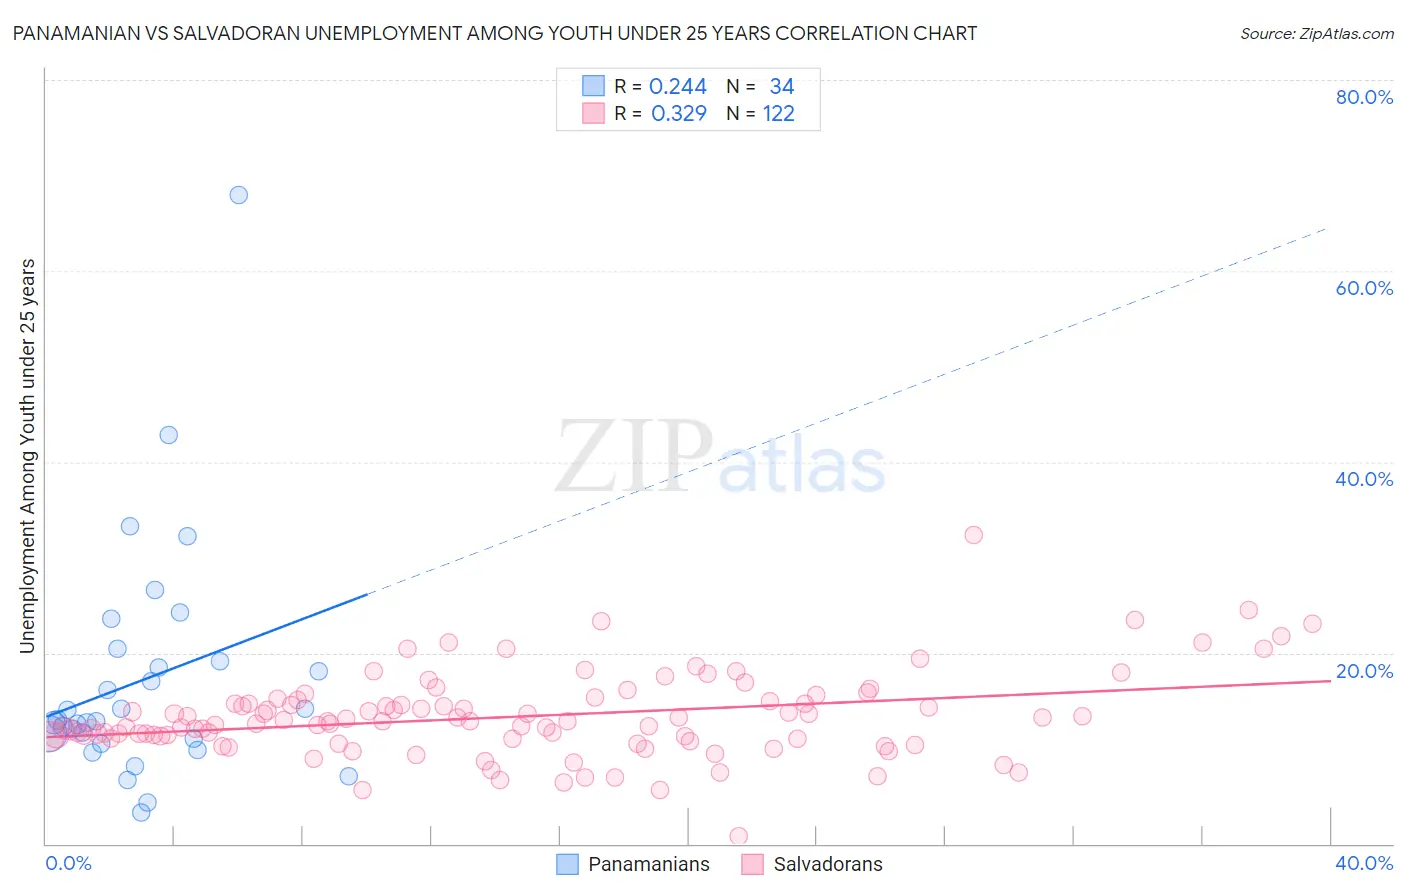
Panamanian vs Salvadoran Unemployment Among Youth under 25 years Correlation Chart
The statistical analysis conducted on geographies consisting of 279,636,521 people shows a weak positive correlation between the proportion of Panamanians and unemployment rate among youth under the age of 25 in the United States with a correlation coefficient (R) of 0.244 and weighted average of 12.4%. Similarly, the statistical analysis conducted on geographies consisting of 394,534,582 people shows a mild positive correlation between the proportion of Salvadorans and unemployment rate among youth under the age of 25 in the United States with a correlation coefficient (R) of 0.329 and weighted average of 12.4%, a difference of 0.030%.
Unemployment Among Youth under 25 years Correlation Summary
| Measurement | Panamanian | Salvadoran |
| Minimum | 3.3% | 0.80% |
| Maximum | 67.9% | 32.4% |
| Range | 64.6% | 31.6% |
| Mean | 17.2% | 13.3% |
| Median | 12.9% | 12.9% |
| Interquartile 25% (IQ1) | 11.0% | 11.0% |
| Interquartile 75% (IQ3) | 19.1% | 14.9% |
| Interquartile Range (IQR) | 8.1% | 3.9% |
| Standard Deviation (Sample) | 12.3% | 4.4% |
| Standard Deviation (Population) | 12.1% | 4.4% |
Demographics Similar to Panamanians and Salvadorans by Unemployment Among Youth under 25 years
In terms of unemployment among youth under 25 years, the demographic groups most similar to Panamanians are Liberian (12.4%, a difference of 0.010%), Hispanic or Latino (12.4%, a difference of 0.080%), Immigrants from Central America (12.4%, a difference of 0.080%), Immigrants from Panama (12.4%, a difference of 0.38%), and Immigrants from El Salvador (12.4%, a difference of 0.39%). Similarly, the demographic groups most similar to Salvadorans are Liberian (12.4%, a difference of 0.040%), Immigrants from Central America (12.4%, a difference of 0.050%), Hispanic or Latino (12.4%, a difference of 0.11%), Immigrants from Panama (12.4%, a difference of 0.35%), and Immigrants from El Salvador (12.4%, a difference of 0.37%).
| Demographics | Rating | Rank | Unemployment Among Youth under 25 years |
| Immigrants | Greece | 0.6 /100 | #247 | Tragic 12.2% |
| Central Americans | 0.6 /100 | #248 | Tragic 12.2% |
| Soviet Union | 0.6 /100 | #249 | Tragic 12.2% |
| Delaware | 0.4 /100 | #250 | Tragic 12.3% |
| Mexican American Indians | 0.4 /100 | #251 | Tragic 12.3% |
| Immigrants | Syria | 0.3 /100 | #252 | Tragic 12.3% |
| Mexicans | 0.3 /100 | #253 | Tragic 12.3% |
| Hondurans | 0.3 /100 | #254 | Tragic 12.3% |
| Hispanics or Latinos | 0.2 /100 | #255 | Tragic 12.4% |
| Liberians | 0.2 /100 | #256 | Tragic 12.4% |
| Panamanians | 0.2 /100 | #257 | Tragic 12.4% |
| Salvadorans | 0.1 /100 | #258 | Tragic 12.4% |
| Immigrants | Central America | 0.1 /100 | #259 | Tragic 12.4% |
| Immigrants | Panama | 0.1 /100 | #260 | Tragic 12.4% |
| Immigrants | El Salvador | 0.1 /100 | #261 | Tragic 12.4% |
| Immigrants | Mexico | 0.1 /100 | #262 | Tragic 12.4% |
| Cree | 0.1 /100 | #263 | Tragic 12.4% |
| Puget Sound Salish | 0.1 /100 | #264 | Tragic 12.5% |
| Nepalese | 0.0 /100 | #265 | Tragic 12.5% |
| Immigrants | Latin America | 0.0 /100 | #266 | Tragic 12.6% |
| Sub-Saharan Africans | 0.0 /100 | #267 | Tragic 12.6% |