Panamanian vs Immigrants from Chile Unemployment Among Ages 35 to 44 years
COMPARE
Panamanian
Immigrants from Chile
Unemployment Among Ages 35 to 44 years
Unemployment Among Ages 35 to 44 years Comparison
Panamanians
Immigrants from Chile
5.0%
UNEMPLOYMENT AMONG AGES 35 TO 44 YEARS
2.9/ 100
METRIC RATING
224th/ 347
METRIC RANK
4.4%
UNEMPLOYMENT AMONG AGES 35 TO 44 YEARS
95.2/ 100
METRIC RATING
84th/ 347
METRIC RANK
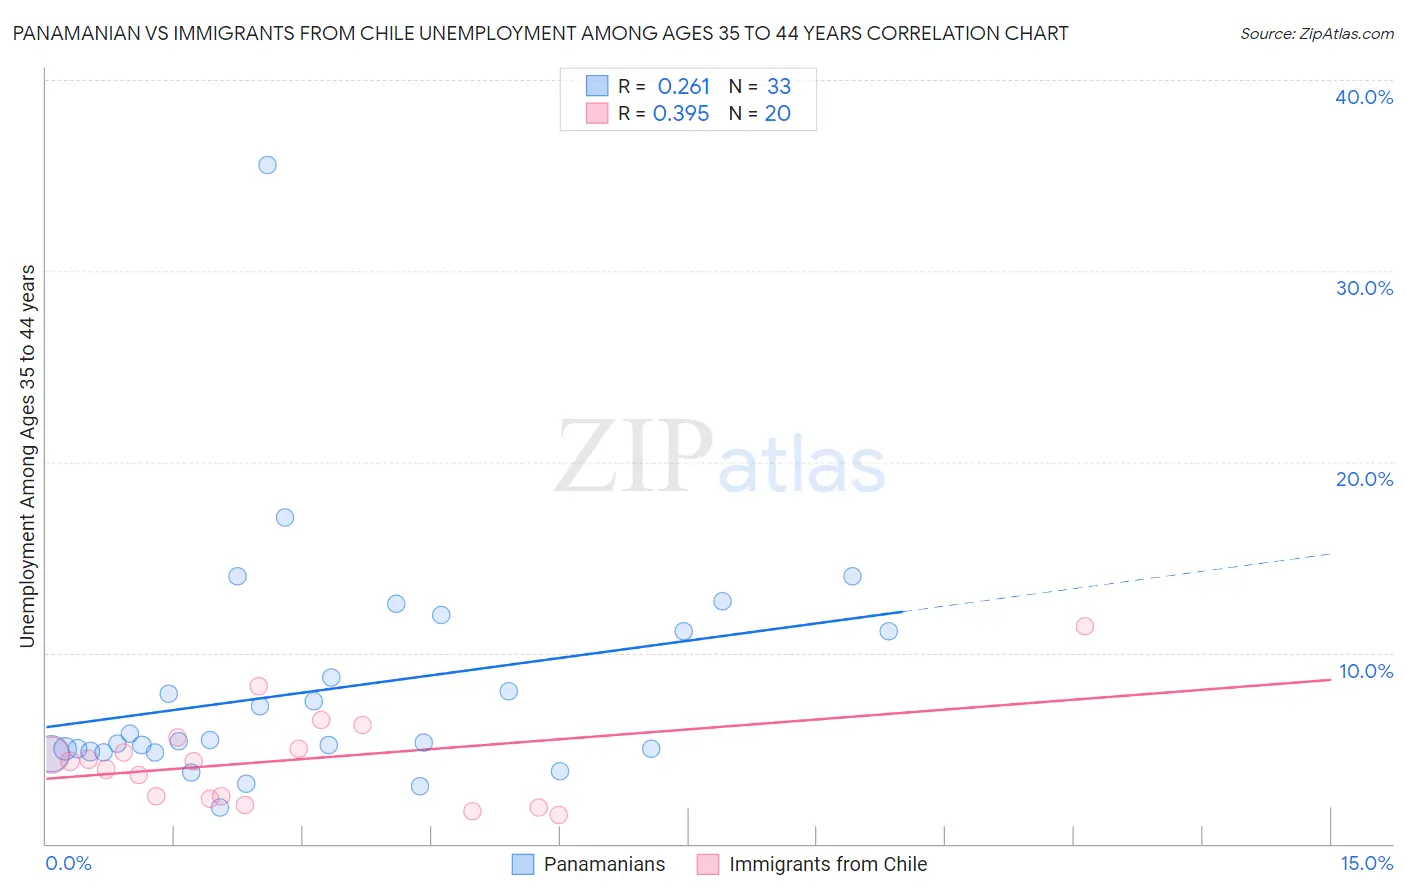
Panamanian vs Immigrants from Chile Unemployment Among Ages 35 to 44 years Correlation Chart
The statistical analysis conducted on geographies consisting of 277,944,879 people shows a weak positive correlation between the proportion of Panamanians and unemployment rate among population between the ages 35 and 44 in the United States with a correlation coefficient (R) of 0.261 and weighted average of 5.0%. Similarly, the statistical analysis conducted on geographies consisting of 216,742,242 people shows a mild positive correlation between the proportion of Immigrants from Chile and unemployment rate among population between the ages 35 and 44 in the United States with a correlation coefficient (R) of 0.395 and weighted average of 4.4%, a difference of 12.1%.
Unemployment Among Ages 35 to 44 years Correlation Summary
| Measurement | Panamanian | Immigrants from Chile |
| Minimum | 1.9% | 1.5% |
| Maximum | 35.5% | 11.4% |
| Range | 33.6% | 9.9% |
| Mean | 8.1% | 4.4% |
| Median | 5.3% | 4.3% |
| Interquartile 25% (IQ1) | 4.8% | 2.4% |
| Interquartile 75% (IQ3) | 11.1% | 5.3% |
| Interquartile Range (IQR) | 6.3% | 2.9% |
| Standard Deviation (Sample) | 6.2% | 2.4% |
| Standard Deviation (Population) | 6.1% | 2.4% |
Similar Demographics by Unemployment Among Ages 35 to 44 years
Demographics Similar to Panamanians by Unemployment Among Ages 35 to 44 years
In terms of unemployment among ages 35 to 44 years, the demographic groups most similar to Panamanians are Immigrants from Lebanon (5.0%, a difference of 0.12%), Immigrants from Panama (5.0%, a difference of 0.23%), Potawatomi (5.0%, a difference of 0.23%), Hmong (5.0%, a difference of 0.31%), and Bermudan (5.0%, a difference of 0.50%).
| Demographics | Rating | Rank | Unemployment Among Ages 35 to 44 years |
| Moroccans | 6.0 /100 | #217 | Tragic 4.9% |
| Chickasaw | 5.7 /100 | #218 | Tragic 4.9% |
| Sierra Leoneans | 4.8 /100 | #219 | Tragic 4.9% |
| Immigrants | Sierra Leone | 4.7 /100 | #220 | Tragic 4.9% |
| Bermudans | 3.9 /100 | #221 | Tragic 5.0% |
| Hmong | 3.5 /100 | #222 | Tragic 5.0% |
| Immigrants | Panama | 3.3 /100 | #223 | Tragic 5.0% |
| Panamanians | 2.9 /100 | #224 | Tragic 5.0% |
| Immigrants | Lebanon | 2.7 /100 | #225 | Tragic 5.0% |
| Potawatomi | 2.5 /100 | #226 | Tragic 5.0% |
| Immigrants | Uzbekistan | 1.9 /100 | #227 | Tragic 5.0% |
| Samoans | 1.8 /100 | #228 | Tragic 5.0% |
| Immigrants | Cambodia | 1.5 /100 | #229 | Tragic 5.0% |
| Liberians | 1.3 /100 | #230 | Tragic 5.1% |
| Japanese | 1.2 /100 | #231 | Tragic 5.1% |
Demographics Similar to Immigrants from Chile by Unemployment Among Ages 35 to 44 years
In terms of unemployment among ages 35 to 44 years, the demographic groups most similar to Immigrants from Chile are Immigrants from Australia (4.4%, a difference of 0.040%), Immigrants from Kenya (4.4%, a difference of 0.080%), Serbian (4.4%, a difference of 0.12%), Immigrants from Bosnia and Herzegovina (4.4%, a difference of 0.15%), and Immigrants from Latvia (4.4%, a difference of 0.17%).
| Demographics | Rating | Rank | Unemployment Among Ages 35 to 44 years |
| Dutch | 96.1 /100 | #77 | Exceptional 4.4% |
| Indians (Asian) | 96.0 /100 | #78 | Exceptional 4.4% |
| Immigrants | Sweden | 95.9 /100 | #79 | Exceptional 4.4% |
| Kenyans | 95.7 /100 | #80 | Exceptional 4.4% |
| Immigrants | Scotland | 95.6 /100 | #81 | Exceptional 4.4% |
| Immigrants | Asia | 95.6 /100 | #82 | Exceptional 4.4% |
| Immigrants | Australia | 95.3 /100 | #83 | Exceptional 4.4% |
| Immigrants | Chile | 95.2 /100 | #84 | Exceptional 4.4% |
| Immigrants | Kenya | 95.0 /100 | #85 | Exceptional 4.4% |
| Serbians | 94.9 /100 | #86 | Exceptional 4.4% |
| Immigrants | Bosnia and Herzegovina | 94.8 /100 | #87 | Exceptional 4.4% |
| Immigrants | Latvia | 94.8 /100 | #88 | Exceptional 4.4% |
| Egyptians | 94.5 /100 | #89 | Exceptional 4.5% |
| Australians | 94.5 /100 | #90 | Exceptional 4.5% |
| Immigrants | Northern Europe | 94.3 /100 | #91 | Exceptional 4.5% |