Panamanian vs Immigrants from Belarus Unemployment Among Ages 65 to 74 years
COMPARE
Panamanian
Immigrants from Belarus
Unemployment Among Ages 65 to 74 years
Unemployment Among Ages 65 to 74 years Comparison
Panamanians
Immigrants from Belarus
5.4%
UNEMPLOYMENT AMONG AGES 65 TO 74 YEARS
51.8/ 100
METRIC RATING
171st/ 347
METRIC RANK
5.3%
UNEMPLOYMENT AMONG AGES 65 TO 74 YEARS
90.1/ 100
METRIC RATING
118th/ 347
METRIC RANK
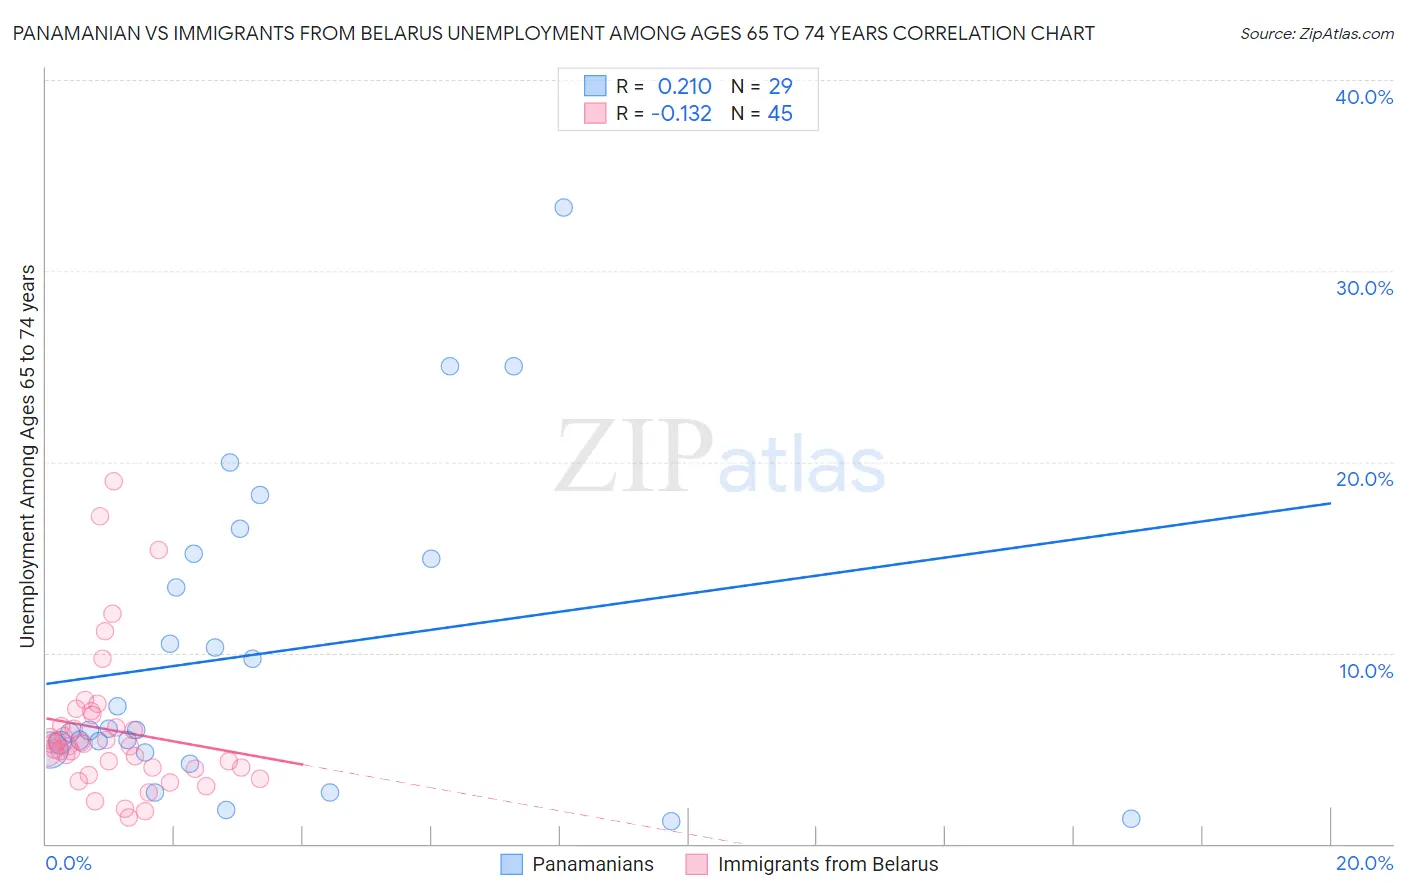
Panamanian vs Immigrants from Belarus Unemployment Among Ages 65 to 74 years Correlation Chart
The statistical analysis conducted on geographies consisting of 256,936,594 people shows a weak positive correlation between the proportion of Panamanians and unemployment rate among population between the ages 65 and 74 in the United States with a correlation coefficient (R) of 0.210 and weighted average of 5.4%. Similarly, the statistical analysis conducted on geographies consisting of 143,080,232 people shows a poor negative correlation between the proportion of Immigrants from Belarus and unemployment rate among population between the ages 65 and 74 in the United States with a correlation coefficient (R) of -0.132 and weighted average of 5.3%, a difference of 1.8%.
Unemployment Among Ages 65 to 74 years Correlation Summary
| Measurement | Panamanian | Immigrants from Belarus |
| Minimum | 1.2% | 1.3% |
| Maximum | 33.3% | 19.0% |
| Range | 32.1% | 17.6% |
| Mean | 9.9% | 6.0% |
| Median | 5.9% | 5.1% |
| Interquartile 25% (IQ1) | 4.8% | 4.0% |
| Interquartile 75% (IQ3) | 15.1% | 6.4% |
| Interquartile Range (IQR) | 10.2% | 2.5% |
| Standard Deviation (Sample) | 8.1% | 3.7% |
| Standard Deviation (Population) | 8.0% | 3.7% |
Similar Demographics by Unemployment Among Ages 65 to 74 years
Demographics Similar to Panamanians by Unemployment Among Ages 65 to 74 years
In terms of unemployment among ages 65 to 74 years, the demographic groups most similar to Panamanians are Greek (5.4%, a difference of 0.020%), Immigrants from Northern Europe (5.4%, a difference of 0.020%), Potawatomi (5.4%, a difference of 0.060%), Syrian (5.4%, a difference of 0.070%), and Immigrants from Iran (5.4%, a difference of 0.090%).
| Demographics | Rating | Rank | Unemployment Among Ages 65 to 74 years |
| Immigrants | Philippines | 61.2 /100 | #164 | Good 5.3% |
| Immigrants | Bosnia and Herzegovina | 60.2 /100 | #165 | Good 5.3% |
| Slovaks | 60.0 /100 | #166 | Good 5.3% |
| Indians (Asian) | 59.9 /100 | #167 | Average 5.3% |
| Whites/Caucasians | 57.2 /100 | #168 | Average 5.4% |
| Laotians | 55.7 /100 | #169 | Average 5.4% |
| Syrians | 53.7 /100 | #170 | Average 5.4% |
| Panamanians | 51.8 /100 | #171 | Average 5.4% |
| Greeks | 51.1 /100 | #172 | Average 5.4% |
| Immigrants | Northern Europe | 51.1 /100 | #173 | Average 5.4% |
| Potawatomi | 50.0 /100 | #174 | Average 5.4% |
| Immigrants | Iran | 49.0 /100 | #175 | Average 5.4% |
| Immigrants | Western Europe | 47.3 /100 | #176 | Average 5.4% |
| Arabs | 46.8 /100 | #177 | Average 5.4% |
| French | 43.1 /100 | #178 | Average 5.4% |
Demographics Similar to Immigrants from Belarus by Unemployment Among Ages 65 to 74 years
In terms of unemployment among ages 65 to 74 years, the demographic groups most similar to Immigrants from Belarus are Immigrants from Korea (5.3%, a difference of 0.010%), Immigrants from Fiji (5.3%, a difference of 0.010%), Immigrants from Switzerland (5.3%, a difference of 0.020%), Australian (5.3%, a difference of 0.030%), and Immigrants from Turkey (5.3%, a difference of 0.070%).
| Demographics | Rating | Rank | Unemployment Among Ages 65 to 74 years |
| Sri Lankans | 92.7 /100 | #111 | Exceptional 5.3% |
| Immigrants | South Central Asia | 92.4 /100 | #112 | Exceptional 5.3% |
| Immigrants | Germany | 91.6 /100 | #113 | Exceptional 5.3% |
| Asians | 91.1 /100 | #114 | Exceptional 5.3% |
| Immigrants | Turkey | 90.8 /100 | #115 | Exceptional 5.3% |
| Australians | 90.4 /100 | #116 | Exceptional 5.3% |
| Immigrants | Korea | 90.2 /100 | #117 | Exceptional 5.3% |
| Immigrants | Belarus | 90.1 /100 | #118 | Exceptional 5.3% |
| Immigrants | Fiji | 89.9 /100 | #119 | Excellent 5.3% |
| Immigrants | Switzerland | 89.9 /100 | #120 | Excellent 5.3% |
| Immigrants | Australia | 89.1 /100 | #121 | Excellent 5.3% |
| Immigrants | Canada | 89.0 /100 | #122 | Excellent 5.3% |
| Czechoslovakians | 88.6 /100 | #123 | Excellent 5.3% |
| Immigrants | Ukraine | 87.5 /100 | #124 | Excellent 5.3% |
| Pakistanis | 87.5 /100 | #125 | Excellent 5.3% |