Panamanian vs Guyanese Unemployment Among Ages 16 to 19 years
COMPARE
Panamanian
Guyanese
Unemployment Among Ages 16 to 19 years
Unemployment Among Ages 16 to 19 years Comparison
Panamanians
Guyanese
18.7%
UNEMPLOYMENT AMONG AGES 16 TO 19 YEARS
0.4/ 100
METRIC RATING
250th/ 347
METRIC RANK
24.8%
UNEMPLOYMENT AMONG AGES 16 TO 19 YEARS
0.0/ 100
METRIC RATING
334th/ 347
METRIC RANK
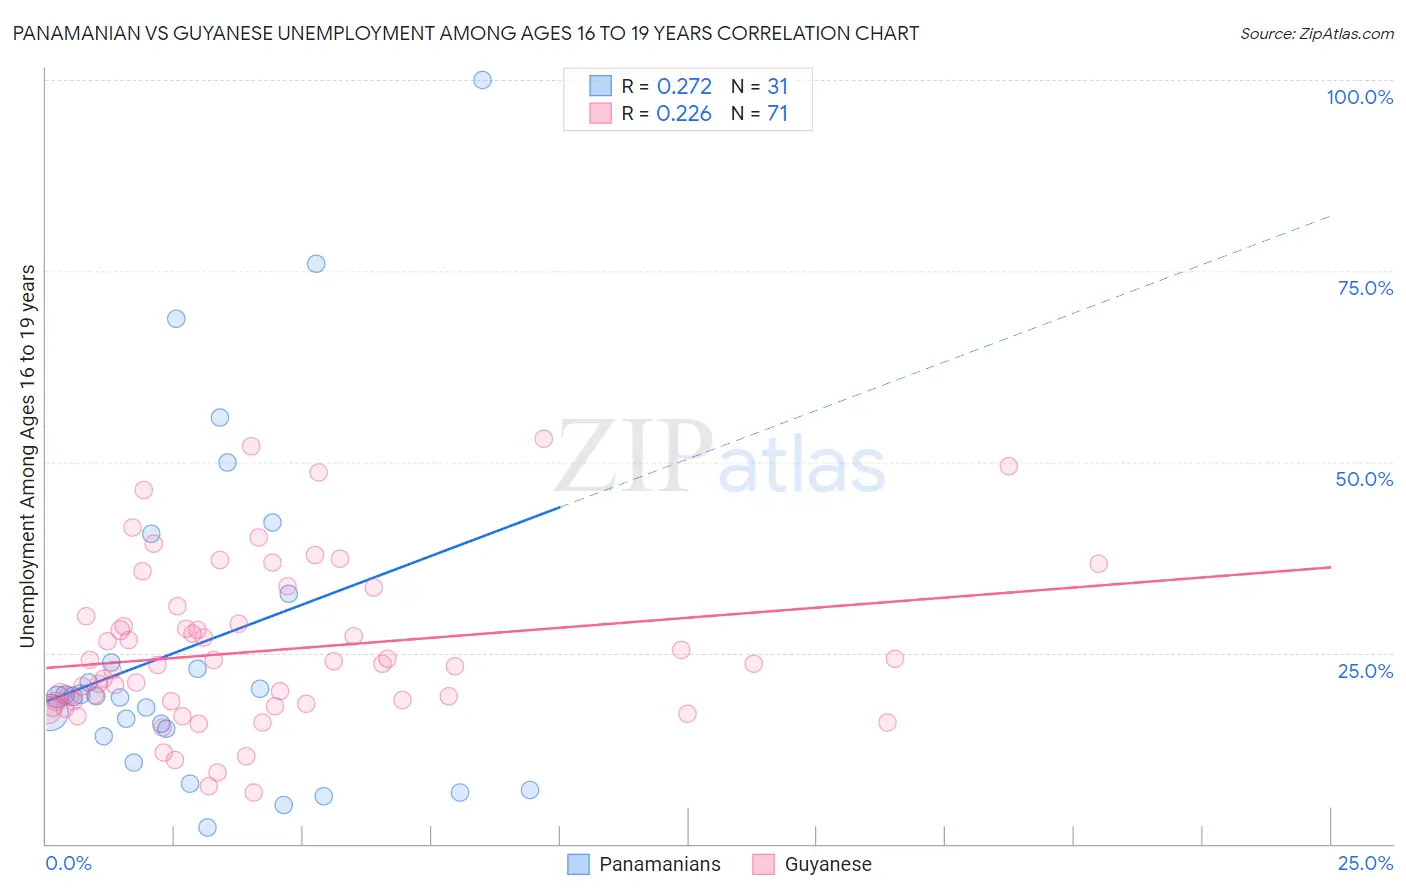
Panamanian vs Guyanese Unemployment Among Ages 16 to 19 years Correlation Chart
The statistical analysis conducted on geographies consisting of 272,796,489 people shows a weak positive correlation between the proportion of Panamanians and unemployment rate among population between the ages 16 and 19 in the United States with a correlation coefficient (R) of 0.272 and weighted average of 18.7%. Similarly, the statistical analysis conducted on geographies consisting of 172,403,884 people shows a weak positive correlation between the proportion of Guyanese and unemployment rate among population between the ages 16 and 19 in the United States with a correlation coefficient (R) of 0.226 and weighted average of 24.8%, a difference of 32.7%.
Unemployment Among Ages 16 to 19 years Correlation Summary
| Measurement | Panamanian | Guyanese |
| Minimum | 2.2% | 6.7% |
| Maximum | 100.0% | 53.0% |
| Range | 97.8% | 46.3% |
| Mean | 26.2% | 25.3% |
| Median | 19.3% | 23.5% |
| Interquartile 25% (IQ1) | 14.1% | 18.4% |
| Interquartile 75% (IQ3) | 32.7% | 29.8% |
| Interquartile Range (IQR) | 18.6% | 11.5% |
| Standard Deviation (Sample) | 22.7% | 10.4% |
| Standard Deviation (Population) | 22.3% | 10.3% |
Similar Demographics by Unemployment Among Ages 16 to 19 years
Demographics Similar to Panamanians by Unemployment Among Ages 16 to 19 years
In terms of unemployment among ages 16 to 19 years, the demographic groups most similar to Panamanians are Puget Sound Salish (18.7%, a difference of 0.11%), Subsaharan African (18.7%, a difference of 0.11%), Immigrants from Guatemala (18.7%, a difference of 0.13%), Delaware (18.7%, a difference of 0.17%), and Immigrants from Israel (18.7%, a difference of 0.20%).
| Demographics | Rating | Rank | Unemployment Among Ages 16 to 19 years |
| Mexicans | 0.9 /100 | #243 | Tragic 18.5% |
| Guatemalans | 0.8 /100 | #244 | Tragic 18.6% |
| Immigrants | Belarus | 0.8 /100 | #245 | Tragic 18.6% |
| Immigrants | South America | 0.5 /100 | #246 | Tragic 18.7% |
| Immigrants | Israel | 0.5 /100 | #247 | Tragic 18.7% |
| Delaware | 0.5 /100 | #248 | Tragic 18.7% |
| Puget Sound Salish | 0.5 /100 | #249 | Tragic 18.7% |
| Panamanians | 0.4 /100 | #250 | Tragic 18.7% |
| Sub-Saharan Africans | 0.4 /100 | #251 | Tragic 18.7% |
| Immigrants | Guatemala | 0.4 /100 | #252 | Tragic 18.7% |
| Central Americans | 0.3 /100 | #253 | Tragic 18.8% |
| Apache | 0.3 /100 | #254 | Tragic 18.8% |
| Immigrants | Cameroon | 0.3 /100 | #255 | Tragic 18.8% |
| Mexican American Indians | 0.3 /100 | #256 | Tragic 18.8% |
| Immigrants | Nigeria | 0.2 /100 | #257 | Tragic 18.9% |
Demographics Similar to Guyanese by Unemployment Among Ages 16 to 19 years
In terms of unemployment among ages 16 to 19 years, the demographic groups most similar to Guyanese are Arapaho (25.2%, a difference of 1.3%), Kiowa (25.2%, a difference of 1.5%), Paiute (24.4%, a difference of 1.9%), Immigrants from Guyana (25.5%, a difference of 2.6%), and Immigrants from Barbados (24.0%, a difference of 3.4%).
| Demographics | Rating | Rank | Unemployment Among Ages 16 to 19 years |
| Pima | 0.0 /100 | #327 | Tragic 23.1% |
| Immigrants | Dominican Republic | 0.0 /100 | #328 | Tragic 23.3% |
| Tlingit-Haida | 0.0 /100 | #329 | Tragic 23.5% |
| Dominicans | 0.0 /100 | #330 | Tragic 23.6% |
| British West Indians | 0.0 /100 | #331 | Tragic 24.0% |
| Immigrants | Barbados | 0.0 /100 | #332 | Tragic 24.0% |
| Paiute | 0.0 /100 | #333 | Tragic 24.4% |
| Guyanese | 0.0 /100 | #334 | Tragic 24.8% |
| Arapaho | 0.0 /100 | #335 | Tragic 25.2% |
| Kiowa | 0.0 /100 | #336 | Tragic 25.2% |
| Immigrants | Guyana | 0.0 /100 | #337 | Tragic 25.5% |
| Immigrants | St. Vincent and the Grenadines | 0.0 /100 | #338 | Tragic 25.7% |
| Immigrants | Grenada | 0.0 /100 | #339 | Tragic 25.7% |
| Crow | 0.0 /100 | #340 | Tragic 26.2% |
| Puerto Ricans | 0.0 /100 | #341 | Tragic 27.5% |