Palestinian vs Immigrants from Morocco Unemployment Among Seniors over 65 years

COMPARE

Palestinian
Race
Ancestry
AfghanAfricanAlaska NativeAlaskan AthabascanAlbanianAleutAlsatianAmericanApacheArabArapahoArgentineanArmenianAssyrian/Chaldean/SyriacAustralianAustrianBahamianBangladeshiBarbadianBasqueBelgianBelizeanBermudanBhutaneseBlackfeetBolivianBrazilianBritishBritish West IndianBulgarianBurmeseCajunCambodianCanadianCape VerdeanCarpatho RusynCelticCentral AmericanCentral American IndianCherokeeCheyenneChickasawChileanChineseChippewaChoctawColombianColvilleComancheCosta RicanCreeCreekCroatianCrowCubanCypriotCzechCzechoslovakianDanishDelawareDominicanDutchDutch West IndianEastern EuropeanEcuadorianEgyptianEnglishEstonianEthiopianEuropeanFijianFilipinoFinnishFrenchFrench American IndianFrench CanadianGermanGerman RussianGhanaianGreekGuamanian/ChamorroGuatemalanGuyaneseHaitianHmongHonduranHopiHoumaHungarianIcelanderIndian (Asian)IndonesianInupiatIranianIraqiIrishIroquoisIsraeliItalianJamaicanJapaneseJordanianKenyanKiowaKoreanLaotianLatvianLebaneseLiberianLithuanianLumbeeLuxembourgerMacedonianMalaysianMalteseMarshalleseMenomineeMexicanMexican American IndianMongolianMoroccanNative HawaiianNavajoNepaleseNew ZealanderNicaraguanNigerianNorthern EuropeanNorwegianOkinawanOsageOttawaPaiutePakistaniPalestinianPanamanianParaguayanPennsylvania GermanPeruvianPimaPolishPortuguesePotawatomiPuebloPuerto RicanPuget Sound SalishRomanianRussianSalvadoranSamoanScandinavianScotch-IrishScottishSeminoleSenegaleseSerbianShoshoneSierra LeoneanSiouxSlavicSlovakSloveneSomaliSouth AfricanSouth AmericanSouth American IndianSoviet UnionSpaniardSpanishSpanish AmericanSpanish American IndianSri LankanSubsaharan AfricanSudaneseSwedishSwissSyrianTaiwaneseThaiTlingit-HaidaTohono O'OdhamTonganTrinidadian and TobagonianTsimshianTurkishU.S. Virgin IslanderUgandanUkrainianUruguayanUteVenezuelanVietnameseWelshWest IndianYakamaYaquiYugoslavianYumanYup'ikZimbabwean
Immigration
NonimmigrantsImmigrantsAfghanistanAfricaAlbaniaArgentinaArmeniaAsiaAustraliaAustriaBahamasBangladeshBarbadosBelarusBelgiumBelizeBoliviaBosnia and HerzegovinaBrazilBulgariaBurma/MyanmarCabo VerdeCambodiaCameroonCanadaCaribbeanCentral AmericaChileChinaColombiaCongoCosta RicaCroatiaCubaCzechoslovakiaDenmarkDominicaDominican RepublicEastern AfricaEastern AsiaEastern EuropeEcuadorEgyptEl SalvadorEnglandEritreaEthiopiaEuropeFijiFranceGermanyGhanaGreeceGrenadaGuatemalaGuyanaHaitiHondurasHong KongHungaryIndiaIndonesiaIranIraqIrelandIsraelItalyJamaicaJapanJordanKazakhstanKenyaKoreaKuwaitLaosLatin AmericaLatviaLebanonLiberiaLithuaniaMalaysiaMexicoMicronesiaMiddle AfricaMoldovaNepalNetherlandsNicaraguaNigeriaNorth AmericaNorth MacedoniaNorthern AfricaNorthern EuropeNorwayOceaniaPakistanPanamaPeruPhilippinesPolandPortugalRomaniaRussiaSaudi ArabiaScotlandSenegalSerbiaSierra LeoneSingaporeSomaliaSouth AfricaSouth AmericaSouth Central AsiaSouth Eastern AsiaSouthern EuropeSpainSri LankaSt. Vincent and the GrenadinesSudanSwedenSwitzerlandSyriaTaiwanThailandTrinidad and TobagoTurkeyUgandaUkraineUruguayUzbekistanVenezuelaVietnamWest IndiesWestern AfricaWestern AsiaWestern EuropeYemenZaireZimbabweAzores
Immigrants from Morocco
Race
Ancestry
AfghanAfricanAlaska NativeAlaskan AthabascanAlbanianAleutAlsatianAmericanApacheArabArapahoArgentineanArmenianAssyrian/Chaldean/SyriacAustralianAustrianBahamianBangladeshiBarbadianBasqueBelgianBelizeanBermudanBhutaneseBlackfeetBolivianBrazilianBritishBritish West IndianBulgarianBurmeseCajunCambodianCanadianCape VerdeanCarpatho RusynCelticCentral AmericanCentral American IndianCherokeeCheyenneChickasawChileanChineseChippewaChoctawColombianColvilleComancheCosta RicanCreeCreekCroatianCrowCubanCypriotCzechCzechoslovakianDanishDelawareDominicanDutchDutch West IndianEastern EuropeanEcuadorianEgyptianEnglishEstonianEthiopianEuropeanFijianFilipinoFinnishFrenchFrench American IndianFrench CanadianGermanGerman RussianGhanaianGreekGuamanian/ChamorroGuatemalanGuyaneseHaitianHmongHonduranHopiHoumaHungarianIcelanderIndian (Asian)IndonesianInupiatIranianIraqiIrishIroquoisIsraeliItalianJamaicanJapaneseJordanianKenyanKiowaKoreanLaotianLatvianLebaneseLiberianLithuanianLumbeeLuxembourgerMacedonianMalaysianMalteseMarshalleseMenomineeMexicanMexican American IndianMongolianMoroccanNative HawaiianNavajoNepaleseNew ZealanderNicaraguanNigerianNorthern EuropeanNorwegianOkinawanOsageOttawaPaiutePakistaniPanamanianParaguayanPennsylvania GermanPeruvianPimaPolishPortuguesePotawatomiPuebloPuerto RicanPuget Sound SalishRomanianRussianSalvadoranSamoanScandinavianScotch-IrishScottishSeminoleSenegaleseSerbianShoshoneSierra LeoneanSiouxSlavicSlovakSloveneSomaliSouth AfricanSouth AmericanSouth American IndianSoviet UnionSpaniardSpanishSpanish AmericanSpanish American IndianSri LankanSubsaharan AfricanSudaneseSwedishSwissSyrianTaiwaneseThaiTlingit-HaidaTohono O'OdhamTonganTrinidadian and TobagonianTsimshianTurkishU.S. Virgin IslanderUgandanUkrainianUruguayanUteVenezuelanVietnameseWelshWest IndianYakamaYaquiYugoslavianYumanYup'ikZimbabwean
Immigration
NonimmigrantsImmigrantsAfghanistanAfricaAlbaniaArgentinaArmeniaAsiaAustraliaAustriaBahamasBangladeshBarbadosBelarusBelgiumBelizeBoliviaBosnia and HerzegovinaBrazilBulgariaBurma/MyanmarCabo VerdeCambodiaCameroonCanadaCaribbeanCentral AmericaChileChinaColombiaCongoCosta RicaCroatiaCubaCzechoslovakiaDenmarkDominicaDominican RepublicEastern AfricaEastern AsiaEastern EuropeEcuadorEgyptEl SalvadorEnglandEritreaEthiopiaEuropeFijiFranceGermanyGhanaGreeceGrenadaGuatemalaGuyanaHaitiHondurasHong KongHungaryIndiaIndonesiaIranIraqIrelandIsraelItalyJamaicaJapanJordanKazakhstanKenyaKoreaKuwaitLaosLatin AmericaLatviaLebanonLiberiaLithuaniaMalaysiaMexicoMicronesiaMiddle AfricaMoldovaMoroccoNepalNetherlandsNicaraguaNigeriaNorth AmericaNorth MacedoniaNorthern AfricaNorthern EuropeNorwayOceaniaPakistanPanamaPeruPhilippinesPolandPortugalRomaniaRussiaSaudi ArabiaScotlandSenegalSerbiaSierra LeoneSingaporeSomaliaSouth AfricaSouth AmericaSouth Central AsiaSouth Eastern AsiaSouthern EuropeSpainSri LankaSt. Vincent and the GrenadinesSudanSwedenSwitzerlandSyriaTaiwanThailandTrinidad and TobagoTurkeyUgandaUkraineUruguayUzbekistanVenezuelaVietnamWest IndiesWestern AfricaWestern AsiaWestern EuropeYemenZaireZimbabweAzores
Unemployment Among Seniors over 65 years
Income
Poverty
Unemployment
Labor Participation
Family Structure
Vehicle Availability
Education Level
Disability

Unemployment Among Seniors over 65 years Comparison

Palestinians

Immigrants from Morocco

Exceptional
Tragic
4.8%
UNEMPLOYMENT AMONG SENIORS OVER 65 YEARS
100.0/ 100
METRIC RATING
33rd/ 347
METRIC RANK
5.4%
UNEMPLOYMENT AMONG SENIORS OVER 65 YEARS
0.1/ 100
METRIC RATING
270th/ 347
METRIC RANK

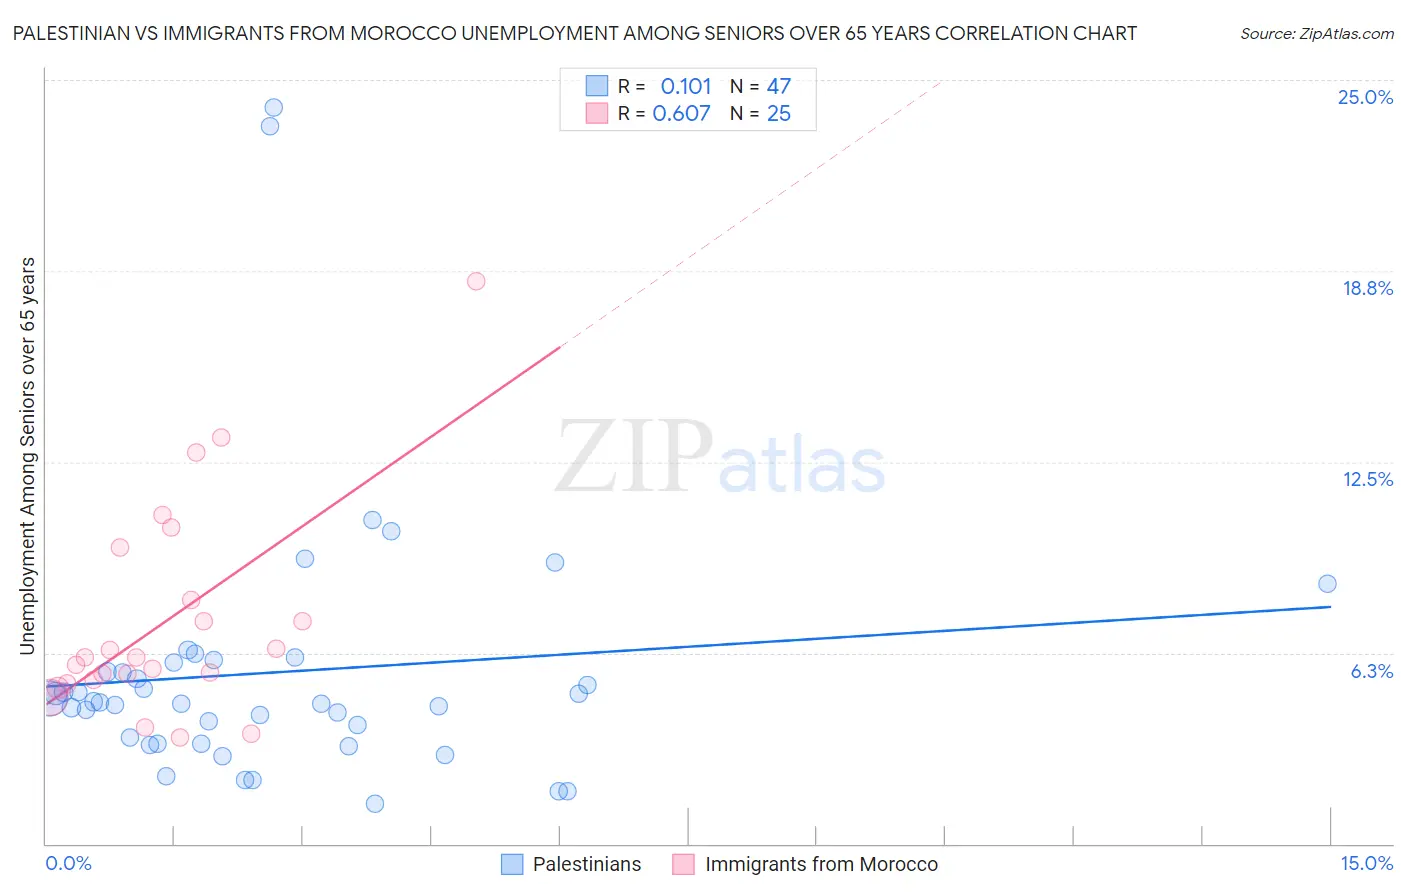
Palestinian vs Immigrants from Morocco Unemployment Among Seniors over 65 years Correlation Chart

The statistical analysis conducted on geographies consisting of 205,968,161 people shows a poor positive correlation between the proportion of Palestinians and unemployment rate amomg seniors over the age of 65 in the United States with a correlation coefficient (R) of 0.101 and weighted average of 4.8%. Similarly, the statistical analysis conducted on geographies consisting of 171,708,146 people shows a significant positive correlation between the proportion of Immigrants from Morocco and unemployment rate amomg seniors over the age of 65 in the United States with a correlation coefficient (R) of 0.607 and weighted average of 5.4%, a difference of 12.8%.
Palestinian vs Immigrants from Morocco Unemployment Among Seniors over 65 years

Unemployment Among Seniors over 65 years Correlation Summary

MeasurementPalestinianImmigrants from Morocco
Minimum1.3%3.5%
Maximum24.1%18.4%
Range22.8%14.9%
Mean5.6%7.3%
Median4.6%6.1%
Interquartile 25% (IQ1)3.3%5.3%
Interquartile 75% (IQ3)5.9%8.8%
Interquartile Range (IQR)2.7%3.5%
Standard Deviation (Sample)4.4%3.5%
Standard Deviation (Population)4.4%3.4%

Similar Demographics by Unemployment Among Seniors over 65 years

Demographics Similar to Palestinians by Unemployment Among Seniors over 65 years

In terms of unemployment among seniors over 65 years, the demographic groups most similar to Palestinians are Immigrants from Uganda (4.8%, a difference of 0.090%), Slovene (4.8%, a difference of 0.090%), Belgian (4.8%, a difference of 0.30%), Bhutanese (4.8%, a difference of 0.34%), and Immigrants from Kuwait (4.8%, a difference of 0.36%).
DemographicsRating | RankUnemployment Among Seniors over 65 years
Immigrants | Lebanon
100.0
/100
|
#26
Exceptional
4.8%
Houma
100.0
/100
|
#27
Exceptional
4.8%
Ugandans
100.0
/100
|
#28
Exceptional
4.8%
Immigrants | North Macedonia
100.0
/100
|
#29
Exceptional
4.8%
Belgians
100.0
/100
|
#30
Exceptional
4.8%
Immigrants | Uganda
100.0
/100
|
#31
Exceptional
4.8%
Slovenes
100.0
/100
|
#32
Exceptional
4.8%
Palestinians
100.0
/100
|
#33
Exceptional
4.8%
Bhutanese
100.0
/100
|
#34
Exceptional
4.8%
Immigrants | Kuwait
100.0
/100
|
#35
Exceptional
4.8%
Cambodians
100.0
/100
|
#36
Exceptional
4.8%
Bulgarians
99.9
/100
|
#37
Exceptional
4.8%
Immigrants | India
99.9
/100
|
#38
Exceptional
4.8%
Macedonians
99.9
/100
|
#39
Exceptional
4.8%
Immigrants | Sweden
99.9
/100
|
#40
Exceptional
4.8%

Demographics Similar to Immigrants from Morocco by Unemployment Among Seniors over 65 years

In terms of unemployment among seniors over 65 years, the demographic groups most similar to Immigrants from Morocco are Cypriot (5.4%, a difference of 0.010%), Immigrants from Jamaica (5.4%, a difference of 0.010%), Immigrants from Nigeria (5.4%, a difference of 0.030%), Immigrants from Southern Europe (5.4%, a difference of 0.070%), and Immigrants from Brazil (5.4%, a difference of 0.070%).
DemographicsRating | RankUnemployment Among Seniors over 65 years
South Americans
0.2
/100
|
#263
Tragic
5.4%
Central American Indians
0.2
/100
|
#264
Tragic
5.4%
Immigrants | Colombia
0.2
/100
|
#265
Tragic
5.4%
Pennsylvania Germans
0.2
/100
|
#266
Tragic
5.4%
Chippewa
0.2
/100
|
#267
Tragic
5.4%
Hawaiians
0.1
/100
|
#268
Tragic
5.4%
Immigrants | Southern Europe
0.1
/100
|
#269
Tragic
5.4%
Immigrants | Morocco
0.1
/100
|
#270
Tragic
5.4%
Cypriots
0.1
/100
|
#271
Tragic
5.4%
Immigrants | Jamaica
0.1
/100
|
#272
Tragic
5.4%
Immigrants | Nigeria
0.1
/100
|
#273
Tragic
5.4%
Immigrants | Brazil
0.1
/100
|
#274
Tragic
5.4%
Mexican American Indians
0.1
/100
|
#275
Tragic
5.4%
Pueblo
0.1
/100
|
#276
Tragic
5.4%
Immigrants | Western Africa
0.1
/100
|
#277
Tragic
5.4%