Palestinian vs Immigrants from Eastern Asia Unemployment Among Women with Children Under 18 years

COMPARE

Palestinian
Race
Ancestry
AfghanAfricanAlaska NativeAlaskan AthabascanAlbanianAleutAlsatianAmericanApacheArabArapahoArgentineanArmenianAssyrian/Chaldean/SyriacAustralianAustrianBahamianBangladeshiBarbadianBasqueBelgianBelizeanBermudanBhutaneseBlackfeetBolivianBrazilianBritishBritish West IndianBulgarianBurmeseCajunCambodianCanadianCape VerdeanCarpatho RusynCelticCentral AmericanCentral American IndianCherokeeCheyenneChickasawChileanChineseChippewaChoctawColombianColvilleComancheCosta RicanCreeCreekCroatianCrowCubanCypriotCzechCzechoslovakianDanishDelawareDominicanDutchDutch West IndianEastern EuropeanEcuadorianEgyptianEnglishEstonianEthiopianEuropeanFijianFilipinoFinnishFrenchFrench American IndianFrench CanadianGermanGerman RussianGhanaianGreekGuamanian/ChamorroGuatemalanGuyaneseHaitianHmongHonduranHopiHoumaHungarianIcelanderIndian (Asian)IndonesianInupiatIranianIraqiIrishIroquoisIsraeliItalianJamaicanJapaneseJordanianKenyanKiowaKoreanLaotianLatvianLebaneseLiberianLithuanianLumbeeLuxembourgerMacedonianMalaysianMalteseMarshalleseMenomineeMexicanMexican American IndianMongolianMoroccanNative HawaiianNavajoNepaleseNew ZealanderNicaraguanNigerianNorthern EuropeanNorwegianOkinawanOsageOttawaPaiutePakistaniPalestinianPanamanianParaguayanPennsylvania GermanPeruvianPimaPolishPortuguesePotawatomiPuebloPuerto RicanPuget Sound SalishRomanianRussianSalvadoranSamoanScandinavianScotch-IrishScottishSeminoleSenegaleseSerbianShoshoneSierra LeoneanSiouxSlavicSlovakSloveneSomaliSouth AfricanSouth AmericanSouth American IndianSoviet UnionSpaniardSpanishSpanish AmericanSpanish American IndianSri LankanSubsaharan AfricanSudaneseSwedishSwissSyrianTaiwaneseThaiTlingit-HaidaTohono O'OdhamTonganTrinidadian and TobagonianTsimshianTurkishU.S. Virgin IslanderUgandanUkrainianUruguayanUteVenezuelanVietnameseWelshWest IndianYakamaYaquiYugoslavianYumanYup'ikZimbabwean
Immigration
NonimmigrantsImmigrantsAfghanistanAfricaAlbaniaArgentinaArmeniaAsiaAustraliaAustriaBahamasBangladeshBarbadosBelarusBelgiumBelizeBoliviaBosnia and HerzegovinaBrazilBulgariaBurma/MyanmarCabo VerdeCambodiaCameroonCanadaCaribbeanCentral AmericaChileChinaColombiaCongoCosta RicaCroatiaCubaCzechoslovakiaDenmarkDominicaDominican RepublicEastern AfricaEastern EuropeEcuadorEgyptEl SalvadorEnglandEritreaEthiopiaEuropeFijiFranceGermanyGhanaGreeceGrenadaGuatemalaGuyanaHaitiHondurasHong KongHungaryIndiaIndonesiaIranIraqIrelandIsraelItalyJamaicaJapanJordanKazakhstanKenyaKoreaKuwaitLaosLatin AmericaLatviaLebanonLiberiaLithuaniaMalaysiaMexicoMicronesiaMiddle AfricaMoldovaMoroccoNepalNetherlandsNicaraguaNigeriaNorth AmericaNorth MacedoniaNorthern AfricaNorthern EuropeNorwayOceaniaPakistanPanamaPeruPhilippinesPolandPortugalRomaniaRussiaSaudi ArabiaScotlandSenegalSerbiaSierra LeoneSingaporeSomaliaSouth AfricaSouth AmericaSouth Central AsiaSouth Eastern AsiaSouthern EuropeSpainSri LankaSt. Vincent and the GrenadinesSudanSwedenSwitzerlandSyriaTaiwanThailandTrinidad and TobagoTurkeyUgandaUkraineUruguayUzbekistanVenezuelaVietnamWest IndiesWestern AfricaWestern AsiaWestern EuropeYemenZaireZimbabweAzores
Immigrants from Eastern Asia
Race
Ancestry
AfghanAfricanAlaska NativeAlaskan AthabascanAlbanianAleutAlsatianAmericanApacheArabArapahoArgentineanArmenianAssyrian/Chaldean/SyriacAustralianAustrianBahamianBangladeshiBarbadianBasqueBelgianBelizeanBermudanBhutaneseBlackfeetBolivianBrazilianBritishBritish West IndianBulgarianBurmeseCajunCambodianCanadianCape VerdeanCarpatho RusynCelticCentral AmericanCentral American IndianCherokeeCheyenneChickasawChileanChineseChippewaChoctawColombianColvilleComancheCosta RicanCreeCreekCroatianCrowCubanCypriotCzechCzechoslovakianDanishDelawareDominicanDutchDutch West IndianEastern EuropeanEcuadorianEgyptianEnglishEstonianEthiopianEuropeanFijianFilipinoFinnishFrenchFrench American IndianFrench CanadianGermanGerman RussianGhanaianGreekGuamanian/ChamorroGuatemalanGuyaneseHaitianHmongHonduranHopiHoumaHungarianIcelanderIndian (Asian)IndonesianInupiatIranianIraqiIrishIroquoisIsraeliItalianJamaicanJapaneseJordanianKenyanKiowaKoreanLaotianLatvianLebaneseLiberianLithuanianLumbeeLuxembourgerMacedonianMalaysianMalteseMarshalleseMenomineeMexicanMexican American IndianMongolianMoroccanNative HawaiianNavajoNepaleseNew ZealanderNicaraguanNigerianNorthern EuropeanNorwegianOkinawanOsageOttawaPaiutePakistaniPanamanianParaguayanPennsylvania GermanPeruvianPimaPolishPortuguesePotawatomiPuebloPuerto RicanPuget Sound SalishRomanianRussianSalvadoranSamoanScandinavianScotch-IrishScottishSeminoleSenegaleseSerbianShoshoneSierra LeoneanSiouxSlavicSlovakSloveneSomaliSouth AfricanSouth AmericanSouth American IndianSoviet UnionSpaniardSpanishSpanish AmericanSpanish American IndianSri LankanSubsaharan AfricanSudaneseSwedishSwissSyrianTaiwaneseThaiTlingit-HaidaTohono O'OdhamTonganTrinidadian and TobagonianTsimshianTurkishU.S. Virgin IslanderUgandanUkrainianUruguayanUteVenezuelanVietnameseWelshWest IndianYakamaYaquiYugoslavianYumanYup'ikZimbabwean
Immigration
NonimmigrantsImmigrantsAfghanistanAfricaAlbaniaArgentinaArmeniaAsiaAustraliaAustriaBahamasBangladeshBarbadosBelarusBelgiumBelizeBoliviaBosnia and HerzegovinaBrazilBulgariaBurma/MyanmarCabo VerdeCambodiaCameroonCanadaCaribbeanCentral AmericaChileChinaColombiaCongoCosta RicaCroatiaCubaCzechoslovakiaDenmarkDominicaDominican RepublicEastern AfricaEastern AsiaEastern EuropeEcuadorEgyptEl SalvadorEnglandEritreaEthiopiaEuropeFijiFranceGermanyGhanaGreeceGrenadaGuatemalaGuyanaHaitiHondurasHong KongHungaryIndiaIndonesiaIranIraqIrelandIsraelItalyJamaicaJapanJordanKazakhstanKenyaKoreaKuwaitLaosLatin AmericaLatviaLebanonLiberiaLithuaniaMalaysiaMexicoMicronesiaMiddle AfricaMoldovaMoroccoNepalNetherlandsNicaraguaNigeriaNorth AmericaNorth MacedoniaNorthern AfricaNorthern EuropeNorwayOceaniaPakistanPanamaPeruPhilippinesPolandPortugalRomaniaRussiaSaudi ArabiaScotlandSenegalSerbiaSierra LeoneSingaporeSomaliaSouth AfricaSouth AmericaSouth Central AsiaSouth Eastern AsiaSouthern EuropeSpainSri LankaSt. Vincent and the GrenadinesSudanSwedenSwitzerlandSyriaTaiwanThailandTrinidad and TobagoTurkeyUgandaUkraineUruguayUzbekistanVenezuelaVietnamWest IndiesWestern AfricaWestern AsiaWestern EuropeYemenZaireZimbabweAzores
Unemployment Among Women with Children Under 18 years
Income
Poverty
Unemployment
Labor Participation
Family Structure
Vehicle Availability
Education Level
Disability

Unemployment Among Women with Children Under 18 years Comparison

Palestinians

Immigrants from Eastern Asia

Exceptional
Exceptional
5.2%
UNEMPLOYMENT AMONG WOMEN WITH CHILDREN UNDER 18 YEARS
92.2/ 100
METRIC RATING
97th/ 347
METRIC RANK
4.9%
UNEMPLOYMENT AMONG WOMEN WITH CHILDREN UNDER 18 YEARS
99.5/ 100
METRIC RATING
28th/ 347
METRIC RANK

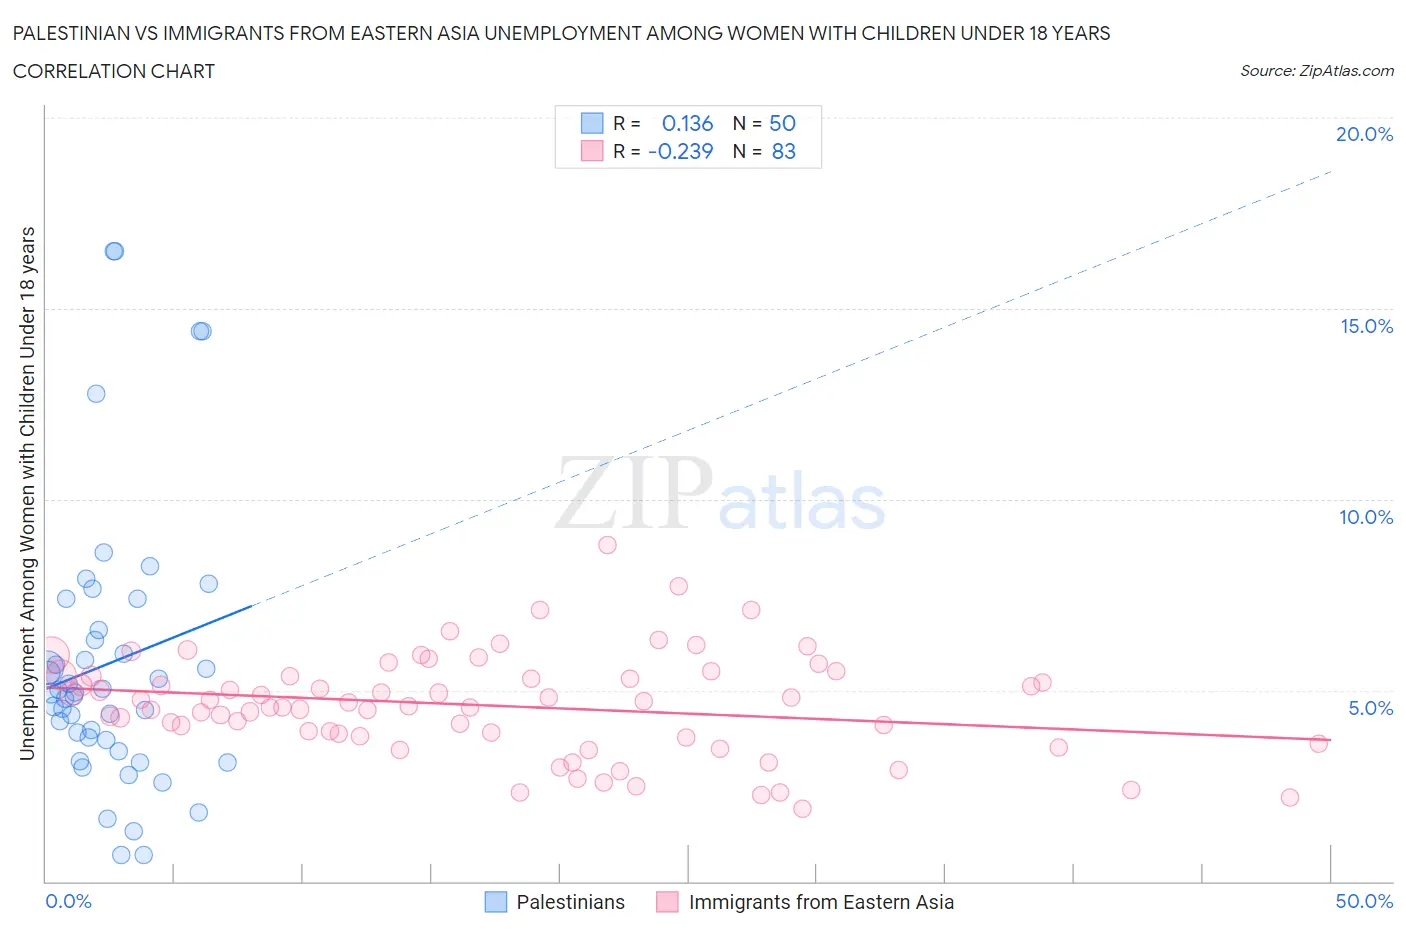
Palestinian vs Immigrants from Eastern Asia Unemployment Among Women with Children Under 18 years Correlation Chart

The statistical analysis conducted on geographies consisting of 212,856,912 people shows a poor positive correlation between the proportion of Palestinians and unemployment rate among women with children under the age of 18 in the United States with a correlation coefficient (R) of 0.136 and weighted average of 5.2%. Similarly, the statistical analysis conducted on geographies consisting of 470,021,238 people shows a weak negative correlation between the proportion of Immigrants from Eastern Asia and unemployment rate among women with children under the age of 18 in the United States with a correlation coefficient (R) of -0.239 and weighted average of 4.9%, a difference of 5.3%.
Palestinian vs Immigrants from Eastern Asia Unemployment Among Women with Children Under 18 years

Unemployment Among Women with Children Under 18 years Correlation Summary

MeasurementPalestinianImmigrants from Eastern Asia
Minimum0.70%1.9%
Maximum16.5%8.8%
Range15.8%6.9%
Mean5.7%4.6%
Median4.9%4.6%
Interquartile 25% (IQ1)3.7%3.8%
Interquartile 75% (IQ3)6.6%5.4%
Interquartile Range (IQR)2.9%1.6%
Standard Deviation (Sample)3.6%1.3%
Standard Deviation (Population)3.6%1.3%

Similar Demographics by Unemployment Among Women with Children Under 18 years

Demographics Similar to Palestinians by Unemployment Among Women with Children Under 18 years

In terms of unemployment among women with children under 18 years, the demographic groups most similar to Palestinians are Immigrants from Albania (5.2%, a difference of 0.0%), Immigrants from North America (5.2%, a difference of 0.020%), Immigrants from Vietnam (5.2%, a difference of 0.040%), Cuban (5.2%, a difference of 0.10%), and Immigrants from Kuwait (5.2%, a difference of 0.11%).
DemographicsRating | RankUnemployment Among Women with Children Under 18 years
Ukrainians
93.8
/100
|
#90
Exceptional
5.2%
Immigrants | Zimbabwe
93.6
/100
|
#91
Exceptional
5.2%
Immigrants | Pakistan
93.3
/100
|
#92
Exceptional
5.2%
Immigrants | Canada
93.3
/100
|
#93
Exceptional
5.2%
Immigrants | Kuwait
92.6
/100
|
#94
Exceptional
5.2%
Immigrants | North America
92.3
/100
|
#95
Exceptional
5.2%
Immigrants | Albania
92.2
/100
|
#96
Exceptional
5.2%
Palestinians
92.2
/100
|
#97
Exceptional
5.2%
Immigrants | Vietnam
92.0
/100
|
#98
Exceptional
5.2%
Cubans
91.8
/100
|
#99
Exceptional
5.2%
Immigrants | Greece
91.4
/100
|
#100
Exceptional
5.2%
Immigrants | Netherlands
91.0
/100
|
#101
Exceptional
5.2%
Immigrants | Cuba
90.9
/100
|
#102
Exceptional
5.2%
Sri Lankans
90.3
/100
|
#103
Exceptional
5.2%
Immigrants | Switzerland
90.1
/100
|
#104
Exceptional
5.2%

Demographics Similar to Immigrants from Eastern Asia by Unemployment Among Women with Children Under 18 years

In terms of unemployment among women with children under 18 years, the demographic groups most similar to Immigrants from Eastern Asia are Finnish (4.9%, a difference of 0.050%), Burmese (4.9%, a difference of 0.12%), Soviet Union (4.9%, a difference of 0.16%), Swiss (4.9%, a difference of 0.23%), and Chinese (4.9%, a difference of 0.34%).
DemographicsRating | RankUnemployment Among Women with Children Under 18 years
Europeans
99.6
/100
|
#21
Exceptional
4.9%
Indians (Asian)
99.6
/100
|
#22
Exceptional
4.9%
Immigrants | China
99.6
/100
|
#23
Exceptional
4.9%
Belgians
99.5
/100
|
#24
Exceptional
4.9%
Chinese
99.5
/100
|
#25
Exceptional
4.9%
Swiss
99.5
/100
|
#26
Exceptional
4.9%
Soviet Union
99.5
/100
|
#27
Exceptional
4.9%
Immigrants | Eastern Asia
99.5
/100
|
#28
Exceptional
4.9%
Finns
99.4
/100
|
#29
Exceptional
4.9%
Burmese
99.4
/100
|
#30
Exceptional
4.9%
Cypriots
99.3
/100
|
#31
Exceptional
5.0%
Dutch
99.3
/100
|
#32
Exceptional
5.0%
Croatians
99.3
/100
|
#33
Exceptional
5.0%
Immigrants | South Central Asia
99.2
/100
|
#34
Exceptional
5.0%
Luxembourgers
99.2
/100
|
#35
Exceptional
5.0%