Okinawan vs Thai Unemployment Among Ages 45 to 54 years
COMPARE
Okinawan
Thai
Unemployment Among Ages 45 to 54 years
Unemployment Among Ages 45 to 54 years Comparison
Okinawans
Thais
4.3%
UNEMPLOYMENT AMONG AGES 45 TO 54 YEARS
99.2/ 100
METRIC RATING
59th/ 347
METRIC RANK
4.0%
UNEMPLOYMENT AMONG AGES 45 TO 54 YEARS
100.0/ 100
METRIC RATING
16th/ 347
METRIC RANK
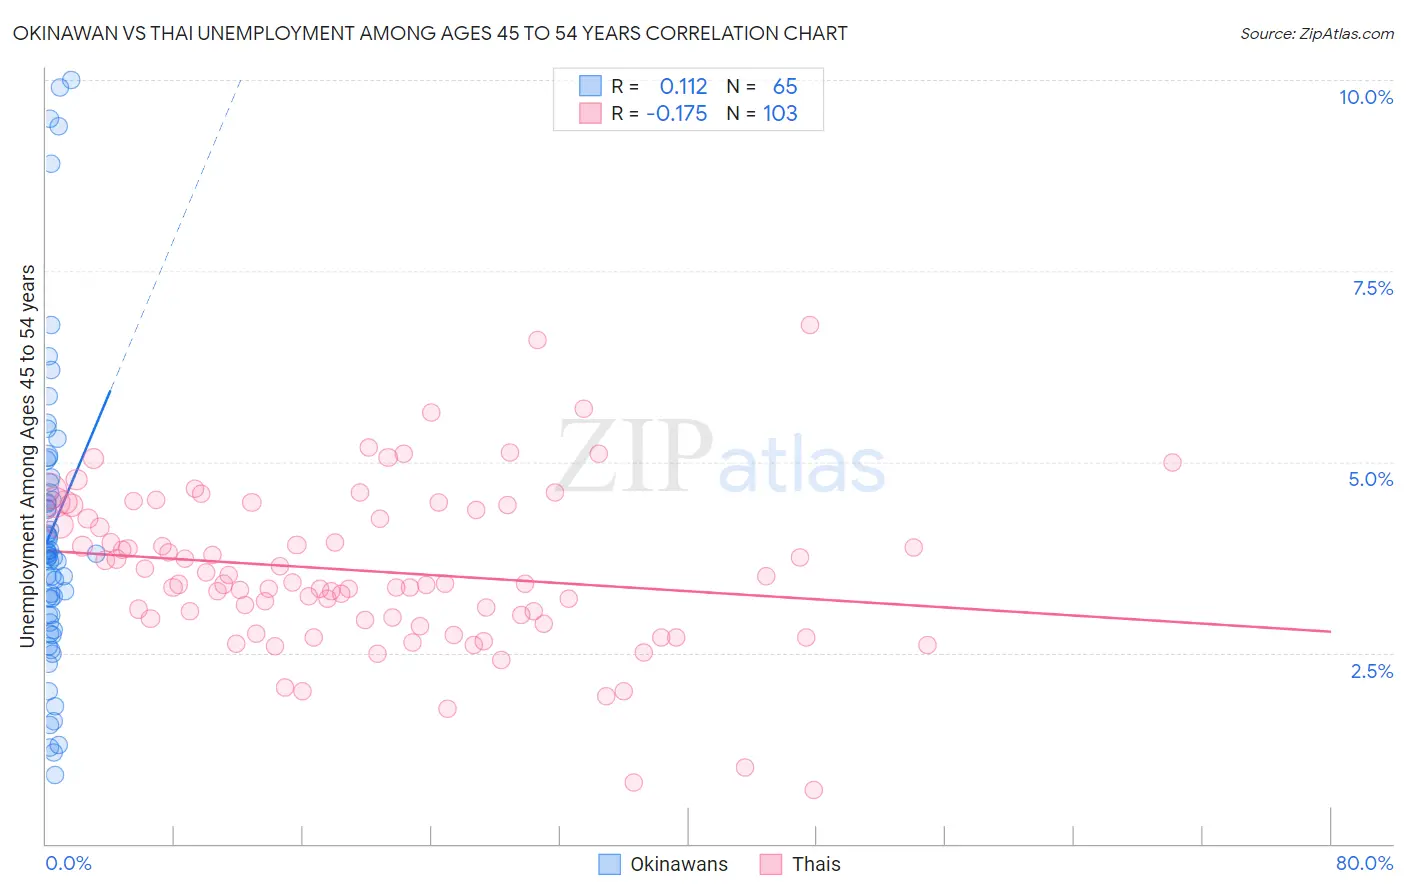
Okinawan vs Thai Unemployment Among Ages 45 to 54 years Correlation Chart
The statistical analysis conducted on geographies consisting of 73,474,495 people shows a poor positive correlation between the proportion of Okinawans and unemployment rate among population between the ages 45 and 54 in the United States with a correlation coefficient (R) of 0.112 and weighted average of 4.3%. Similarly, the statistical analysis conducted on geographies consisting of 459,729,720 people shows a poor negative correlation between the proportion of Thais and unemployment rate among population between the ages 45 and 54 in the United States with a correlation coefficient (R) of -0.175 and weighted average of 4.0%, a difference of 5.8%.
Unemployment Among Ages 45 to 54 years Correlation Summary
| Measurement | Okinawan | Thai |
| Minimum | 0.90% | 0.70% |
| Maximum | 10.0% | 6.8% |
| Range | 9.1% | 6.1% |
| Mean | 4.1% | 3.6% |
| Median | 3.8% | 3.4% |
| Interquartile 25% (IQ1) | 2.9% | 2.9% |
| Interquartile 75% (IQ3) | 4.8% | 4.4% |
| Interquartile Range (IQR) | 1.8% | 1.4% |
| Standard Deviation (Sample) | 2.0% | 1.1% |
| Standard Deviation (Population) | 2.0% | 1.1% |
Similar Demographics by Unemployment Among Ages 45 to 54 years
Demographics Similar to Okinawans by Unemployment Among Ages 45 to 54 years
In terms of unemployment among ages 45 to 54 years, the demographic groups most similar to Okinawans are Immigrants from Korea (4.3%, a difference of 0.030%), Immigrants from Pakistan (4.3%, a difference of 0.040%), Greek (4.3%, a difference of 0.080%), Immigrants from Sri Lanka (4.3%, a difference of 0.13%), and Lithuanian (4.3%, a difference of 0.17%).
| Demographics | Rating | Rank | Unemployment Among Ages 45 to 54 years |
| Poles | 99.5 /100 | #52 | Exceptional 4.2% |
| Irish | 99.5 /100 | #53 | Exceptional 4.2% |
| Chickasaw | 99.5 /100 | #54 | Exceptional 4.2% |
| Latvians | 99.4 /100 | #55 | Exceptional 4.2% |
| Immigrants | Jordan | 99.3 /100 | #56 | Exceptional 4.3% |
| Immigrants | Sri Lanka | 99.3 /100 | #57 | Exceptional 4.3% |
| Greeks | 99.3 /100 | #58 | Exceptional 4.3% |
| Okinawans | 99.2 /100 | #59 | Exceptional 4.3% |
| Immigrants | Korea | 99.2 /100 | #60 | Exceptional 4.3% |
| Immigrants | Pakistan | 99.2 /100 | #61 | Exceptional 4.3% |
| Lithuanians | 99.1 /100 | #62 | Exceptional 4.3% |
| Pennsylvania Germans | 99.1 /100 | #63 | Exceptional 4.3% |
| Austrians | 99.0 /100 | #64 | Exceptional 4.3% |
| Immigrants | Sudan | 99.0 /100 | #65 | Exceptional 4.3% |
| Turks | 98.9 /100 | #66 | Exceptional 4.3% |
Demographics Similar to Thais by Unemployment Among Ages 45 to 54 years
In terms of unemployment among ages 45 to 54 years, the demographic groups most similar to Thais are Immigrants from Bolivia (4.0%, a difference of 0.19%), Tongan (4.1%, a difference of 0.55%), German (4.1%, a difference of 0.56%), Immigrants from Bosnia and Herzegovina (4.0%, a difference of 0.63%), and Cuban (4.0%, a difference of 0.68%).
| Demographics | Rating | Rank | Unemployment Among Ages 45 to 54 years |
| Czechs | 100.0 /100 | #9 | Exceptional 4.0% |
| Venezuelans | 100.0 /100 | #10 | Exceptional 4.0% |
| Scandinavians | 100.0 /100 | #11 | Exceptional 4.0% |
| Swedes | 100.0 /100 | #12 | Exceptional 4.0% |
| Cubans | 100.0 /100 | #13 | Exceptional 4.0% |
| Immigrants | Bosnia and Herzegovina | 100.0 /100 | #14 | Exceptional 4.0% |
| Immigrants | Bolivia | 100.0 /100 | #15 | Exceptional 4.0% |
| Thais | 100.0 /100 | #16 | Exceptional 4.0% |
| Tongans | 100.0 /100 | #17 | Exceptional 4.1% |
| Germans | 100.0 /100 | #18 | Exceptional 4.1% |
| Swiss | 100.0 /100 | #19 | Exceptional 4.1% |
| English | 100.0 /100 | #20 | Exceptional 4.1% |
| Europeans | 100.0 /100 | #21 | Exceptional 4.1% |
| Yugoslavians | 100.0 /100 | #22 | Exceptional 4.1% |
| Bulgarians | 100.0 /100 | #23 | Exceptional 4.1% |