Norwegian vs Swedish Unemployment Among Ages 30 to 34 years
COMPARE
Norwegian
Swedish
Unemployment Among Ages 30 to 34 years
Unemployment Among Ages 30 to 34 years Comparison
Norwegians
Swedes
5.0%
UNEMPLOYMENT AMONG AGES 30 TO 34 YEARS
99.4/ 100
METRIC RATING
30th/ 347
METRIC RANK
5.1%
UNEMPLOYMENT AMONG AGES 30 TO 34 YEARS
97.1/ 100
METRIC RATING
59th/ 347
METRIC RANK
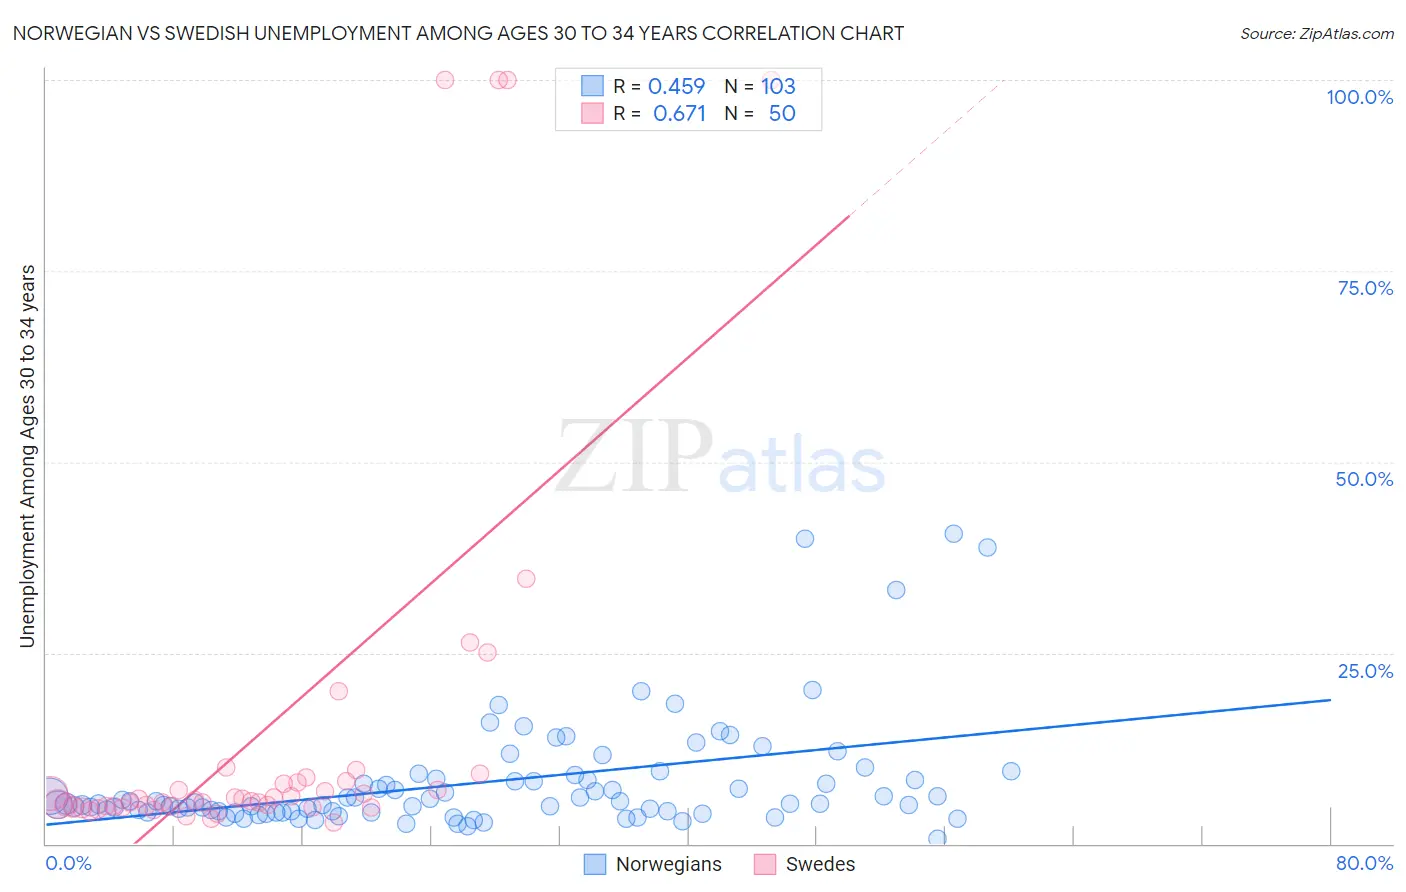
Norwegian vs Swedish Unemployment Among Ages 30 to 34 years Correlation Chart
The statistical analysis conducted on geographies consisting of 473,244,016 people shows a moderate positive correlation between the proportion of Norwegians and unemployment rate among population between the ages 30 and 34 in the United States with a correlation coefficient (R) of 0.459 and weighted average of 5.0%. Similarly, the statistical analysis conducted on geographies consisting of 476,792,089 people shows a significant positive correlation between the proportion of Swedes and unemployment rate among population between the ages 30 and 34 in the United States with a correlation coefficient (R) of 0.671 and weighted average of 5.1%, a difference of 3.0%.
Unemployment Among Ages 30 to 34 years Correlation Summary
| Measurement | Norwegian | Swedish |
| Minimum | 0.70% | 2.8% |
| Maximum | 40.6% | 100.0% |
| Range | 39.9% | 97.2% |
| Mean | 8.0% | 15.0% |
| Median | 5.3% | 5.8% |
| Interquartile 25% (IQ1) | 4.2% | 4.9% |
| Interquartile 75% (IQ3) | 8.3% | 8.2% |
| Interquartile Range (IQR) | 4.1% | 3.3% |
| Standard Deviation (Sample) | 7.3% | 26.0% |
| Standard Deviation (Population) | 7.3% | 25.8% |
Similar Demographics by Unemployment Among Ages 30 to 34 years
Demographics Similar to Norwegians by Unemployment Among Ages 30 to 34 years
In terms of unemployment among ages 30 to 34 years, the demographic groups most similar to Norwegians are German Russian (5.0%, a difference of 0.020%), Immigrants from Cuba (5.0%, a difference of 0.040%), Somali (5.0%, a difference of 0.090%), Immigrants from Zaire (5.0%, a difference of 0.13%), and Immigrants from Saudi Arabia (5.0%, a difference of 0.23%).
| Demographics | Rating | Rank | Unemployment Among Ages 30 to 34 years |
| Hmong | 99.8 /100 | #23 | Exceptional 4.9% |
| Ugandans | 99.7 /100 | #24 | Exceptional 4.9% |
| Immigrants | Singapore | 99.5 /100 | #25 | Exceptional 5.0% |
| Immigrants | Kuwait | 99.5 /100 | #26 | Exceptional 5.0% |
| Danes | 99.5 /100 | #27 | Exceptional 5.0% |
| Immigrants | Cuba | 99.4 /100 | #28 | Exceptional 5.0% |
| German Russians | 99.4 /100 | #29 | Exceptional 5.0% |
| Norwegians | 99.4 /100 | #30 | Exceptional 5.0% |
| Somalis | 99.3 /100 | #31 | Exceptional 5.0% |
| Immigrants | Zaire | 99.3 /100 | #32 | Exceptional 5.0% |
| Immigrants | Saudi Arabia | 99.3 /100 | #33 | Exceptional 5.0% |
| Latvians | 99.3 /100 | #34 | Exceptional 5.0% |
| Immigrants | Ethiopia | 99.2 /100 | #35 | Exceptional 5.0% |
| Czechs | 99.2 /100 | #36 | Exceptional 5.0% |
| Immigrants | Turkey | 99.0 /100 | #37 | Exceptional 5.0% |
Demographics Similar to Swedes by Unemployment Among Ages 30 to 34 years
In terms of unemployment among ages 30 to 34 years, the demographic groups most similar to Swedes are Immigrants from Somalia (5.1%, a difference of 0.010%), Indian (Asian) (5.1%, a difference of 0.030%), Immigrants from France (5.1%, a difference of 0.050%), Belgian (5.1%, a difference of 0.060%), and Asian (5.1%, a difference of 0.080%).
| Demographics | Rating | Rank | Unemployment Among Ages 30 to 34 years |
| Immigrants | Burma/Myanmar | 98.1 /100 | #52 | Exceptional 5.1% |
| Cubans | 98.1 /100 | #53 | Exceptional 5.1% |
| Immigrants | Morocco | 97.9 /100 | #54 | Exceptional 5.1% |
| Chinese | 97.7 /100 | #55 | Exceptional 5.1% |
| Immigrants | Serbia | 97.4 /100 | #56 | Exceptional 5.1% |
| Immigrants | China | 97.2 /100 | #57 | Exceptional 5.1% |
| Asians | 97.2 /100 | #58 | Exceptional 5.1% |
| Swedes | 97.1 /100 | #59 | Exceptional 5.1% |
| Immigrants | Somalia | 97.1 /100 | #60 | Exceptional 5.1% |
| Indians (Asian) | 97.0 /100 | #61 | Exceptional 5.1% |
| Immigrants | France | 97.0 /100 | #62 | Exceptional 5.1% |
| Belgians | 97.0 /100 | #63 | Exceptional 5.1% |
| Immigrants | Eastern Asia | 96.9 /100 | #64 | Exceptional 5.1% |
| Immigrants | Japan | 96.8 /100 | #65 | Exceptional 5.1% |
| Immigrants | Zimbabwe | 96.7 /100 | #66 | Exceptional 5.1% |