Northern European vs Immigrants from Zimbabwe Unemployment Among Ages 16 to 19 years
COMPARE
Northern European
Immigrants from Zimbabwe
Unemployment Among Ages 16 to 19 years
Unemployment Among Ages 16 to 19 years Comparison
Northern Europeans
Immigrants from Zimbabwe
16.6%
UNEMPLOYMENT AMONG AGES 16 TO 19 YEARS
99.0/ 100
METRIC RATING
64th/ 347
METRIC RANK
16.3%
UNEMPLOYMENT AMONG AGES 16 TO 19 YEARS
99.7/ 100
METRIC RATING
44th/ 347
METRIC RANK
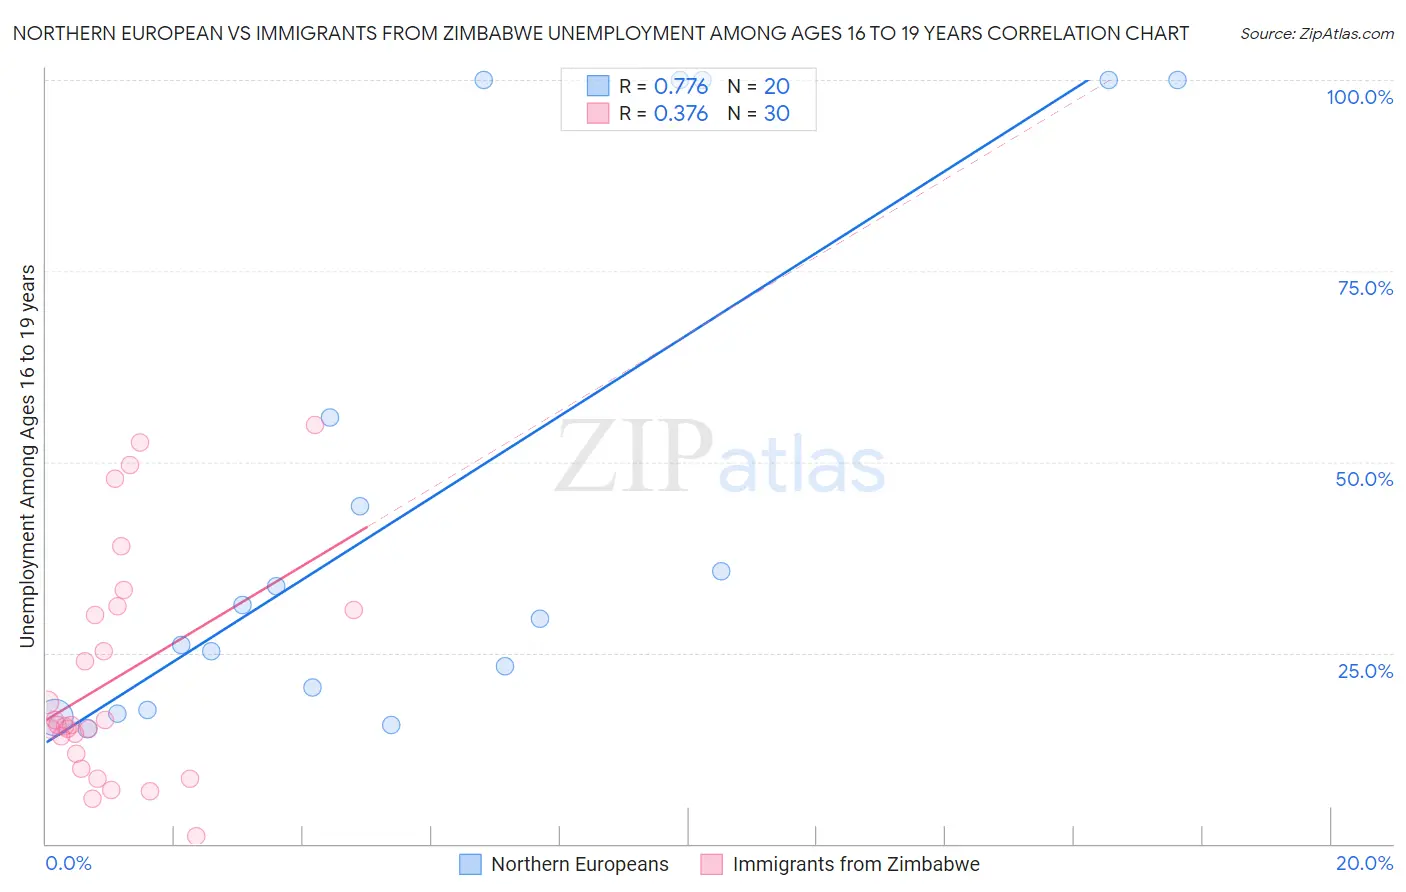
Northern European vs Immigrants from Zimbabwe Unemployment Among Ages 16 to 19 years Correlation Chart
The statistical analysis conducted on geographies consisting of 380,694,439 people shows a strong positive correlation between the proportion of Northern Europeans and unemployment rate among population between the ages 16 and 19 in the United States with a correlation coefficient (R) of 0.776 and weighted average of 16.6%. Similarly, the statistical analysis conducted on geographies consisting of 115,703,102 people shows a mild positive correlation between the proportion of Immigrants from Zimbabwe and unemployment rate among population between the ages 16 and 19 in the United States with a correlation coefficient (R) of 0.376 and weighted average of 16.3%, a difference of 1.7%.
Unemployment Among Ages 16 to 19 years Correlation Summary
| Measurement | Northern European | Immigrants from Zimbabwe |
| Minimum | 15.1% | 1.0% |
| Maximum | 100.0% | 54.9% |
| Range | 84.9% | 53.9% |
| Mean | 45.3% | 21.6% |
| Median | 30.3% | 15.6% |
| Interquartile 25% (IQ1) | 19.0% | 11.8% |
| Interquartile 75% (IQ3) | 77.9% | 30.6% |
| Interquartile Range (IQR) | 58.9% | 18.8% |
| Standard Deviation (Sample) | 33.9% | 14.8% |
| Standard Deviation (Population) | 33.0% | 14.5% |
Demographics Similar to Northern Europeans and Immigrants from Zimbabwe by Unemployment Among Ages 16 to 19 years
In terms of unemployment among ages 16 to 19 years, the demographic groups most similar to Northern Europeans are Scotch-Irish (16.6%, a difference of 0.070%), Macedonian (16.6%, a difference of 0.25%), Immigrants from Cuba (16.6%, a difference of 0.35%), Menominee (16.6%, a difference of 0.41%), and Irish (16.5%, a difference of 0.58%). Similarly, the demographic groups most similar to Immigrants from Zimbabwe are Polish (16.4%, a difference of 0.020%), Immigrants from North Macedonia (16.4%, a difference of 0.040%), Immigrants from Vietnam (16.4%, a difference of 0.11%), Maltese (16.4%, a difference of 0.15%), and Iraqi (16.4%, a difference of 0.23%).
| Demographics | Rating | Rank | Unemployment Among Ages 16 to 19 years |
| Immigrants | Zimbabwe | 99.7 /100 | #44 | Exceptional 16.3% |
| Poles | 99.7 /100 | #45 | Exceptional 16.4% |
| Immigrants | North Macedonia | 99.7 /100 | #46 | Exceptional 16.4% |
| Immigrants | Vietnam | 99.7 /100 | #47 | Exceptional 16.4% |
| Maltese | 99.7 /100 | #48 | Exceptional 16.4% |
| Iraqis | 99.7 /100 | #49 | Exceptional 16.4% |
| Bhutanese | 99.6 /100 | #50 | Exceptional 16.4% |
| Lebanese | 99.6 /100 | #51 | Exceptional 16.4% |
| Welsh | 99.6 /100 | #52 | Exceptional 16.4% |
| Slovenes | 99.6 /100 | #53 | Exceptional 16.4% |
| British | 99.5 /100 | #54 | Exceptional 16.5% |
| Czechoslovakians | 99.5 /100 | #55 | Exceptional 16.5% |
| Sri Lankans | 99.5 /100 | #56 | Exceptional 16.5% |
| Immigrants | Jordan | 99.4 /100 | #57 | Exceptional 16.5% |
| Immigrants | Uganda | 99.4 /100 | #58 | Exceptional 16.5% |
| Irish | 99.4 /100 | #59 | Exceptional 16.5% |
| Menominee | 99.3 /100 | #60 | Exceptional 16.6% |
| Immigrants | Cuba | 99.2 /100 | #61 | Exceptional 16.6% |
| Macedonians | 99.2 /100 | #62 | Exceptional 16.6% |
| Scotch-Irish | 99.1 /100 | #63 | Exceptional 16.6% |
| Northern Europeans | 99.0 /100 | #64 | Exceptional 16.6% |