Northern European vs Immigrants from Italy Unemployment
COMPARE
Northern European
Immigrants from Italy
Unemployment
Unemployment Comparison
Northern Europeans
Immigrants from Italy
4.8%
UNEMPLOYMENT
99.7/ 100
METRIC RATING
40th/ 347
METRIC RANK
5.1%
UNEMPLOYMENT
79.1/ 100
METRIC RATING
148th/ 347
METRIC RANK
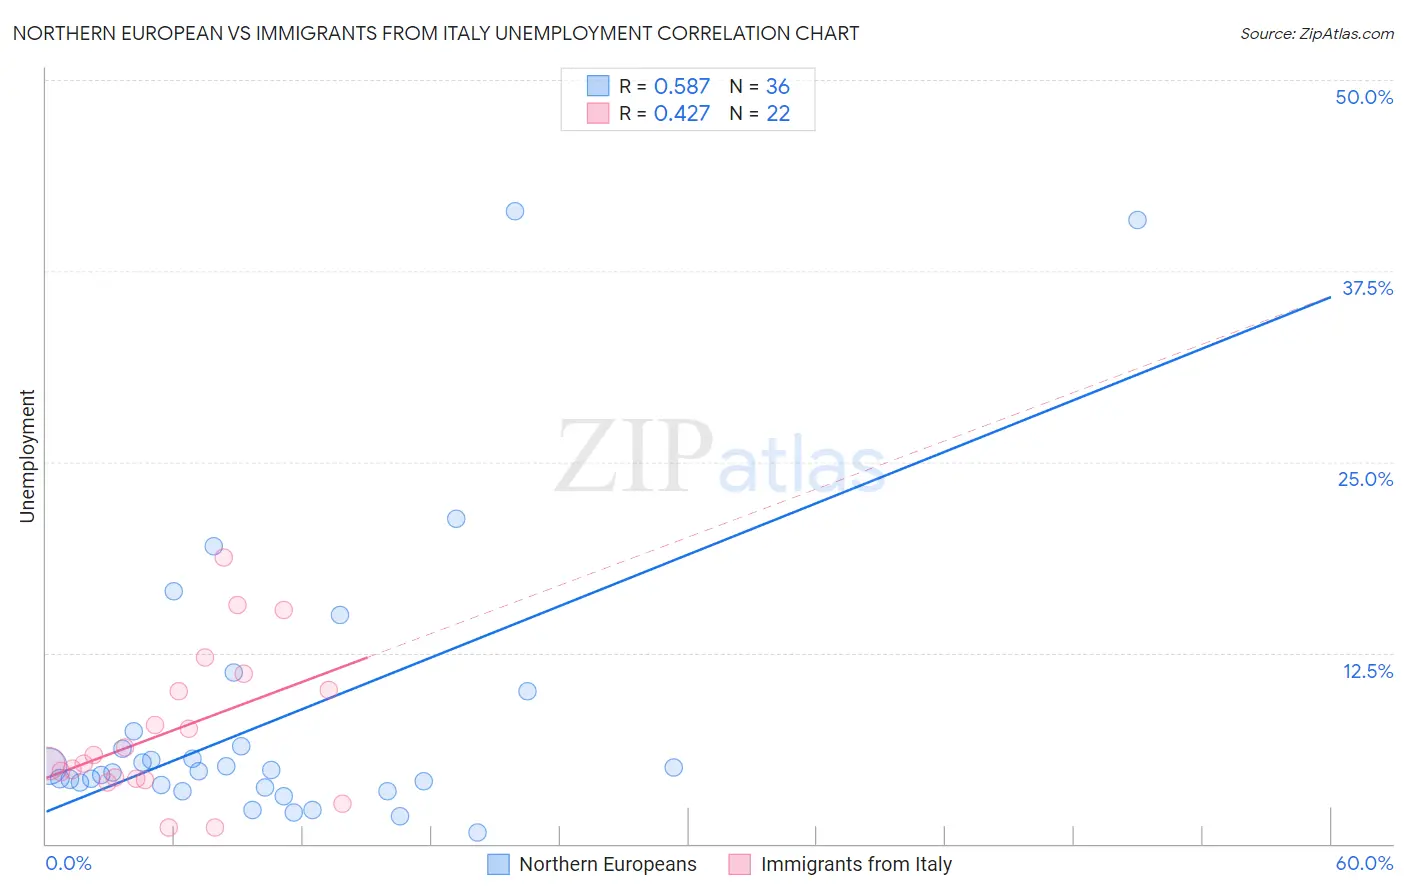
Northern European vs Immigrants from Italy Unemployment Correlation Chart
The statistical analysis conducted on geographies consisting of 405,473,873 people shows a substantial positive correlation between the proportion of Northern Europeans and unemployment in the United States with a correlation coefficient (R) of 0.587 and weighted average of 4.8%. Similarly, the statistical analysis conducted on geographies consisting of 324,002,453 people shows a moderate positive correlation between the proportion of Immigrants from Italy and unemployment in the United States with a correlation coefficient (R) of 0.427 and weighted average of 5.1%, a difference of 7.3%.
Unemployment Correlation Summary
| Measurement | Northern European | Immigrants from Italy |
| Minimum | 0.70% | 1.1% |
| Maximum | 41.4% | 18.8% |
| Range | 40.7% | 17.7% |
| Mean | 8.1% | 7.4% |
| Median | 4.8% | 5.5% |
| Interquartile 25% (IQ1) | 3.7% | 4.3% |
| Interquartile 75% (IQ3) | 6.9% | 10.1% |
| Interquartile Range (IQR) | 3.1% | 5.8% |
| Standard Deviation (Sample) | 9.4% | 4.8% |
| Standard Deviation (Population) | 9.3% | 4.7% |
Similar Demographics by Unemployment
Demographics Similar to Northern Europeans by Unemployment
In terms of unemployment, the demographic groups most similar to Northern Europeans are Lithuanian (4.8%, a difference of 0.020%), Immigrants from Bosnia and Herzegovina (4.8%, a difference of 0.030%), Bolivian (4.8%, a difference of 0.16%), Czechoslovakian (4.8%, a difference of 0.35%), and Tongan (4.8%, a difference of 0.42%).
| Demographics | Rating | Rank | Unemployment |
| Sudanese | 99.8 /100 | #33 | Exceptional 4.8% |
| Immigrants | Bolivia | 99.8 /100 | #34 | Exceptional 4.8% |
| Scotch-Irish | 99.8 /100 | #35 | Exceptional 4.8% |
| Tongans | 99.7 /100 | #36 | Exceptional 4.8% |
| Czechoslovakians | 99.7 /100 | #37 | Exceptional 4.8% |
| Bolivians | 99.7 /100 | #38 | Exceptional 4.8% |
| Lithuanians | 99.7 /100 | #39 | Exceptional 4.8% |
| Northern Europeans | 99.7 /100 | #40 | Exceptional 4.8% |
| Immigrants | Bosnia and Herzegovina | 99.7 /100 | #41 | Exceptional 4.8% |
| Filipinos | 99.5 /100 | #42 | Exceptional 4.8% |
| Yugoslavians | 99.5 /100 | #43 | Exceptional 4.8% |
| Austrians | 99.5 /100 | #44 | Exceptional 4.8% |
| French | 99.5 /100 | #45 | Exceptional 4.8% |
| Immigrants | Nepal | 99.4 /100 | #46 | Exceptional 4.8% |
| Immigrants | Taiwan | 99.4 /100 | #47 | Exceptional 4.8% |
Demographics Similar to Immigrants from Italy by Unemployment
In terms of unemployment, the demographic groups most similar to Immigrants from Italy are Syrian (5.2%, a difference of 0.13%), Indian (Asian) (5.1%, a difference of 0.26%), Potawatomi (5.2%, a difference of 0.26%), Immigrants from Norway (5.1%, a difference of 0.27%), and Immigrants from Asia (5.1%, a difference of 0.27%).
| Demographics | Rating | Rank | Unemployment |
| Palestinians | 83.4 /100 | #141 | Excellent 5.1% |
| Immigrants | Pakistan | 83.2 /100 | #142 | Excellent 5.1% |
| Immigrants | Chile | 82.8 /100 | #143 | Excellent 5.1% |
| Indonesians | 82.3 /100 | #144 | Excellent 5.1% |
| Immigrants | Norway | 81.8 /100 | #145 | Excellent 5.1% |
| Immigrants | Asia | 81.8 /100 | #146 | Excellent 5.1% |
| Indians (Asian) | 81.6 /100 | #147 | Excellent 5.1% |
| Immigrants | Italy | 79.1 /100 | #148 | Good 5.1% |
| Syrians | 77.7 /100 | #149 | Good 5.2% |
| Potawatomi | 76.2 /100 | #150 | Good 5.2% |
| Immigrants | Eastern Europe | 75.3 /100 | #151 | Good 5.2% |
| Immigrants | Hong Kong | 75.2 /100 | #152 | Good 5.2% |
| Egyptians | 75.2 /100 | #153 | Good 5.2% |
| Immigrants | China | 74.7 /100 | #154 | Good 5.2% |
| Immigrants | Northern Africa | 71.3 /100 | #155 | Good 5.2% |