Nonimmigrants vs Native Hawaiian Female Unemployment
COMPARE
Nonimmigrants
Native Hawaiian
Female Unemployment
Female Unemployment Comparison
Nonimmigrants
Native Hawaiians
5.3%
FEMALE UNEMPLOYMENT
42.6/ 100
METRIC RATING
182nd/ 347
METRIC RANK
5.2%
FEMALE UNEMPLOYMENT
62.7/ 100
METRIC RATING
166th/ 347
METRIC RANK
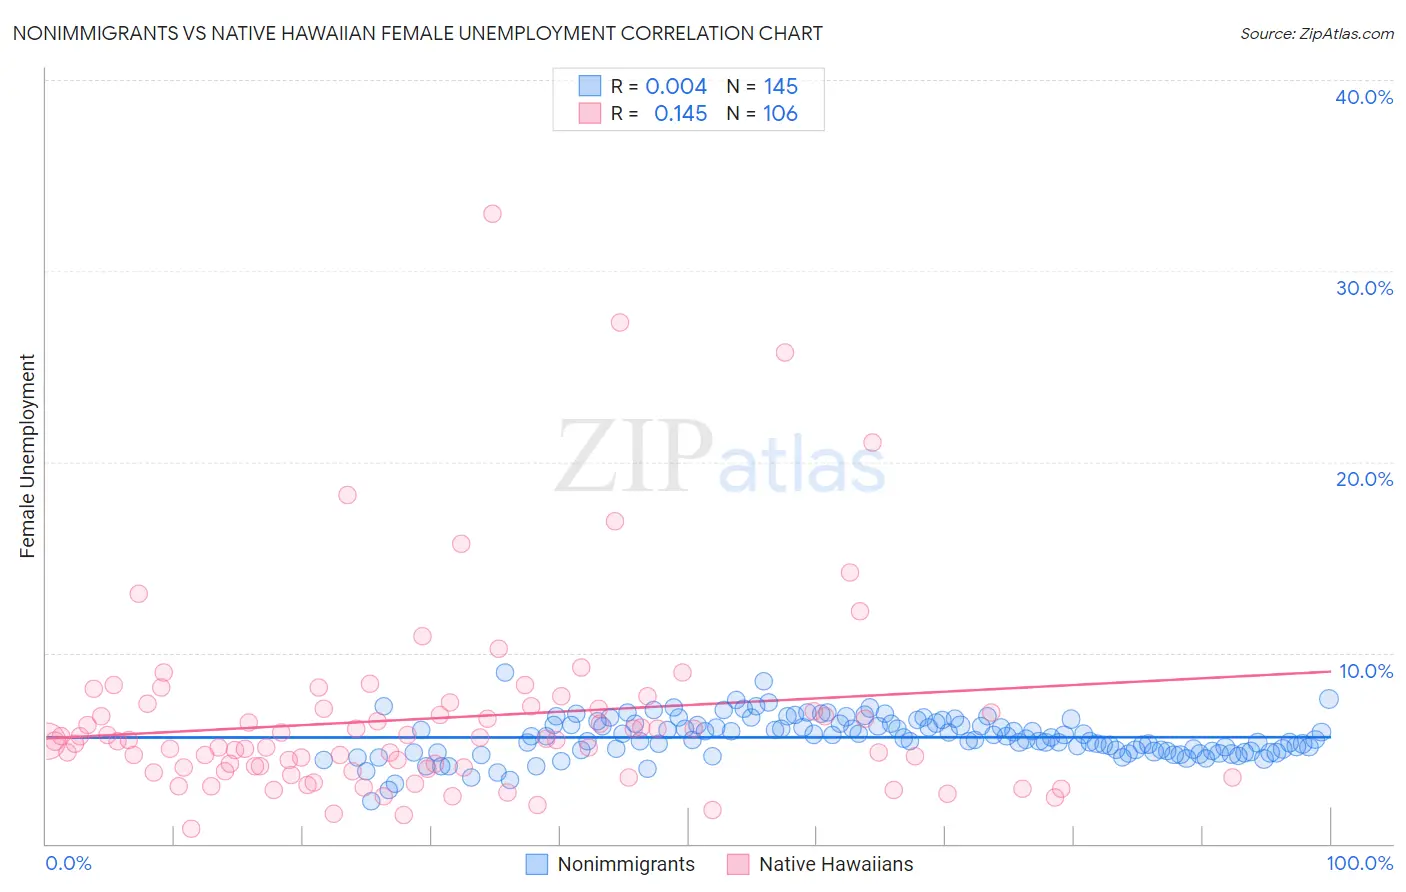
Nonimmigrants vs Native Hawaiian Female Unemployment Correlation Chart
The statistical analysis conducted on geographies consisting of 567,351,562 people shows no correlation between the proportion of Nonimmigrants and unemploymnet rate among females in the United States with a correlation coefficient (R) of 0.004 and weighted average of 5.3%. Similarly, the statistical analysis conducted on geographies consisting of 330,662,641 people shows a poor positive correlation between the proportion of Native Hawaiians and unemploymnet rate among females in the United States with a correlation coefficient (R) of 0.145 and weighted average of 5.2%, a difference of 1.2%.
Female Unemployment Correlation Summary
| Measurement | Nonimmigrants | Native Hawaiian |
| Minimum | 2.2% | 0.80% |
| Maximum | 9.0% | 33.0% |
| Range | 6.8% | 32.2% |
| Mean | 5.6% | 6.6% |
| Median | 5.5% | 5.4% |
| Interquartile 25% (IQ1) | 4.8% | 4.0% |
| Interquartile 75% (IQ3) | 6.3% | 7.1% |
| Interquartile Range (IQR) | 1.4% | 3.1% |
| Standard Deviation (Sample) | 1.1% | 5.1% |
| Standard Deviation (Population) | 1.1% | 5.1% |
Demographics Similar to Nonimmigrants and Native Hawaiians by Female Unemployment
In terms of female unemployment, the demographic groups most similar to Nonimmigrants are Taiwanese (5.3%, a difference of 0.010%), Immigrants from Congo (5.3%, a difference of 0.030%), Immigrants from Indonesia (5.3%, a difference of 0.12%), Laotian (5.3%, a difference of 0.15%), and Immigrants from Ukraine (5.3%, a difference of 0.15%). Similarly, the demographic groups most similar to Native Hawaiians are Syrian (5.2%, a difference of 0.0%), Immigrants from Thailand (5.2%, a difference of 0.040%), Bangladeshi (5.2%, a difference of 0.10%), Sri Lankan (5.2%, a difference of 0.21%), and Immigrants from Chile (5.2%, a difference of 0.24%).
| Demographics | Rating | Rank | Female Unemployment |
| Bangladeshis | 64.3 /100 | #164 | Good 5.2% |
| Syrians | 62.8 /100 | #165 | Good 5.2% |
| Native Hawaiians | 62.7 /100 | #166 | Good 5.2% |
| Immigrants | Thailand | 62.1 /100 | #167 | Good 5.2% |
| Sri Lankans | 59.4 /100 | #168 | Average 5.2% |
| Immigrants | Chile | 59.0 /100 | #169 | Average 5.2% |
| Spanish | 55.9 /100 | #170 | Average 5.2% |
| Immigrants | Denmark | 55.0 /100 | #171 | Average 5.2% |
| Immigrants | Uganda | 50.7 /100 | #172 | Average 5.3% |
| Iranians | 50.4 /100 | #173 | Average 5.3% |
| Immigrants | Poland | 50.0 /100 | #174 | Average 5.3% |
| Immigrants | Laos | 47.5 /100 | #175 | Average 5.3% |
| Immigrants | Vietnam | 47.5 /100 | #176 | Average 5.3% |
| Immigrants | Morocco | 47.4 /100 | #177 | Average 5.3% |
| Immigrants | Southern Europe | 46.2 /100 | #178 | Average 5.3% |
| Laotians | 45.1 /100 | #179 | Average 5.3% |
| Immigrants | Congo | 43.1 /100 | #180 | Average 5.3% |
| Taiwanese | 42.7 /100 | #181 | Average 5.3% |
| Immigrants | Nonimmigrants | 42.6 /100 | #182 | Average 5.3% |
| Immigrants | Indonesia | 40.7 /100 | #183 | Average 5.3% |
| Immigrants | Ukraine | 40.1 /100 | #184 | Average 5.3% |