Nonimmigrants vs Immigrants from the Azores Unemployment Among Ages 35 to 44 years

COMPARE

Nonimmigrants
Race
Ancestry
AfghanAfricanAlaska NativeAlaskan AthabascanAlbanianAleutAlsatianAmericanApacheArabArapahoArgentineanArmenianAssyrian/Chaldean/SyriacAustralianAustrianBahamianBangladeshiBarbadianBasqueBelgianBelizeanBermudanBhutaneseBlackfeetBolivianBrazilianBritishBritish West IndianBulgarianBurmeseCajunCambodianCanadianCape VerdeanCarpatho RusynCelticCentral AmericanCentral American IndianCherokeeCheyenneChickasawChileanChineseChippewaChoctawColombianColvilleComancheCosta RicanCreeCreekCroatianCrowCubanCypriotCzechCzechoslovakianDanishDelawareDominicanDutchDutch West IndianEastern EuropeanEcuadorianEgyptianEnglishEstonianEthiopianEuropeanFijianFilipinoFinnishFrenchFrench American IndianFrench CanadianGermanGerman RussianGhanaianGreekGuamanian/ChamorroGuatemalanGuyaneseHaitianHmongHonduranHopiHoumaHungarianIcelanderIndian (Asian)IndonesianInupiatIranianIraqiIrishIroquoisIsraeliItalianJamaicanJapaneseJordanianKenyanKiowaKoreanLaotianLatvianLebaneseLiberianLithuanianLumbeeLuxembourgerMacedonianMalaysianMalteseMarshalleseMenomineeMexicanMexican American IndianMongolianMoroccanNative HawaiianNavajoNepaleseNew ZealanderNicaraguanNigerianNorthern EuropeanNorwegianOkinawanOsageOttawaPaiutePakistaniPalestinianPanamanianParaguayanPennsylvania GermanPeruvianPimaPolishPortuguesePotawatomiPuebloPuerto RicanPuget Sound SalishRomanianRussianSalvadoranSamoanScandinavianScotch-IrishScottishSeminoleSenegaleseSerbianShoshoneSierra LeoneanSiouxSlavicSlovakSloveneSomaliSouth AfricanSouth AmericanSouth American IndianSoviet UnionSpaniardSpanishSpanish AmericanSpanish American IndianSri LankanSubsaharan AfricanSudaneseSwedishSwissSyrianTaiwaneseThaiTlingit-HaidaTohono O'OdhamTonganTrinidadian and TobagonianTsimshianTurkishU.S. Virgin IslanderUgandanUkrainianUruguayanUteVenezuelanVietnameseWelshWest IndianYakamaYaquiYugoslavianYumanYup'ikZimbabwean
Immigration
NonimmigrantsImmigrantsAfghanistanAfricaAlbaniaArgentinaArmeniaAsiaAustraliaAustriaBahamasBangladeshBarbadosBelarusBelgiumBelizeBoliviaBosnia and HerzegovinaBrazilBulgariaBurma/MyanmarCabo VerdeCambodiaCameroonCanadaCaribbeanCentral AmericaChileChinaColombiaCongoCosta RicaCroatiaCubaCzechoslovakiaDenmarkDominicaDominican RepublicEastern AfricaEastern AsiaEastern EuropeEcuadorEgyptEl SalvadorEnglandEritreaEthiopiaEuropeFijiFranceGermanyGhanaGreeceGrenadaGuatemalaGuyanaHaitiHondurasHong KongHungaryIndiaIndonesiaIranIraqIrelandIsraelItalyJamaicaJapanJordanKazakhstanKenyaKoreaKuwaitLaosLatin AmericaLatviaLebanonLiberiaLithuaniaMalaysiaMexicoMicronesiaMiddle AfricaMoldovaMoroccoNepalNetherlandsNicaraguaNigeriaNorth AmericaNorth MacedoniaNorthern AfricaNorthern EuropeNorwayOceaniaPakistanPanamaPeruPhilippinesPolandPortugalRomaniaRussiaSaudi ArabiaScotlandSenegalSerbiaSierra LeoneSingaporeSomaliaSouth AfricaSouth AmericaSouth Central AsiaSouth Eastern AsiaSouthern EuropeSpainSri LankaSt. Vincent and the GrenadinesSudanSwedenSwitzerlandSyriaTaiwanThailandTrinidad and TobagoTurkeyUgandaUkraineUruguayUzbekistanVenezuelaVietnamWest IndiesWestern AfricaWestern AsiaWestern EuropeYemenZaireZimbabwe
Immigrants from the Azores
Race
Ancestry
AfghanAfricanAlaska NativeAlaskan AthabascanAlbanianAleutAlsatianAmericanApacheArabArapahoArgentineanArmenianAssyrian/Chaldean/SyriacAustralianAustrianBahamianBangladeshiBarbadianBasqueBelgianBelizeanBermudanBhutaneseBlackfeetBolivianBrazilianBritishBritish West IndianBulgarianBurmeseCajunCambodianCanadianCape VerdeanCarpatho RusynCelticCentral AmericanCentral American IndianCherokeeCheyenneChickasawChileanChineseChippewaChoctawColombianColvilleComancheCosta RicanCreeCreekCroatianCrowCubanCypriotCzechCzechoslovakianDanishDelawareDominicanDutchDutch West IndianEastern EuropeanEcuadorianEgyptianEnglishEstonianEthiopianEuropeanFijianFilipinoFinnishFrenchFrench American IndianFrench CanadianGermanGerman RussianGhanaianGreekGuamanian/ChamorroGuatemalanGuyaneseHaitianHmongHonduranHopiHoumaHungarianIcelanderIndian (Asian)IndonesianInupiatIranianIraqiIrishIroquoisIsraeliItalianJamaicanJapaneseJordanianKenyanKiowaKoreanLaotianLatvianLebaneseLiberianLithuanianLumbeeLuxembourgerMacedonianMalaysianMalteseMarshalleseMenomineeMexicanMexican American IndianMongolianMoroccanNative HawaiianNavajoNepaleseNew ZealanderNicaraguanNigerianNorthern EuropeanNorwegianOkinawanOsageOttawaPaiutePakistaniPalestinianPanamanianParaguayanPennsylvania GermanPeruvianPimaPolishPortuguesePotawatomiPuebloPuerto RicanPuget Sound SalishRomanianRussianSalvadoranSamoanScandinavianScotch-IrishScottishSeminoleSenegaleseSerbianShoshoneSierra LeoneanSiouxSlavicSlovakSloveneSomaliSouth AfricanSouth AmericanSouth American IndianSoviet UnionSpaniardSpanishSpanish AmericanSpanish American IndianSri LankanSubsaharan AfricanSudaneseSwedishSwissSyrianTaiwaneseThaiTlingit-HaidaTohono O'OdhamTonganTrinidadian and TobagonianTsimshianTurkishU.S. Virgin IslanderUgandanUkrainianUruguayanUteVenezuelanVietnameseWelshWest IndianYakamaYaquiYugoslavianYumanYup'ikZimbabwean
Immigration
ImmigrantsAfghanistanAfricaAlbaniaArgentinaArmeniaAsiaAustraliaAustriaBahamasBangladeshBarbadosBelarusBelgiumBelizeBoliviaBosnia and HerzegovinaBrazilBulgariaBurma/MyanmarCabo VerdeCambodiaCameroonCanadaCaribbeanCentral AmericaChileChinaColombiaCongoCosta RicaCroatiaCubaCzechoslovakiaDenmarkDominicaDominican RepublicEastern AfricaEastern AsiaEastern EuropeEcuadorEgyptEl SalvadorEnglandEritreaEthiopiaEuropeFijiFranceGermanyGhanaGreeceGrenadaGuatemalaGuyanaHaitiHondurasHong KongHungaryIndiaIndonesiaIranIraqIrelandIsraelItalyJamaicaJapanJordanKazakhstanKenyaKoreaKuwaitLaosLatin AmericaLatviaLebanonLiberiaLithuaniaMalaysiaMexicoMicronesiaMiddle AfricaMoldovaMoroccoNepalNetherlandsNicaraguaNigeriaNorth AmericaNorth MacedoniaNorthern AfricaNorthern EuropeNorwayOceaniaPakistanPanamaPeruPhilippinesPolandPortugalRomaniaRussiaSaudi ArabiaScotlandSenegalSerbiaSierra LeoneSingaporeSomaliaSouth AfricaSouth AmericaSouth Central AsiaSouth Eastern AsiaSouthern EuropeSpainSri LankaSt. Vincent and the GrenadinesSudanSwedenSwitzerlandSyriaTaiwanThailandTrinidad and TobagoTurkeyUgandaUkraineUruguayUzbekistanVenezuelaVietnamWest IndiesWestern AfricaWestern AsiaWestern EuropeYemenZaireZimbabweAzores
Unemployment Among Ages 35 to 44 years
Income
Poverty
Unemployment
Labor Participation
Family Structure
Vehicle Availability
Education Level
Disability

Unemployment Among Ages 35 to 44 years Comparison

Nonimmigrants

Immigrants from the Azores

Tragic
Tragic
4.9%
UNEMPLOYMENT AMONG AGES 35 TO 44 YEARS
9.4/ 100
METRIC RATING
211th/ 347
METRIC RANK
5.8%
UNEMPLOYMENT AMONG AGES 35 TO 44 YEARS
0.0/ 100
METRIC RATING
308th/ 347
METRIC RANK

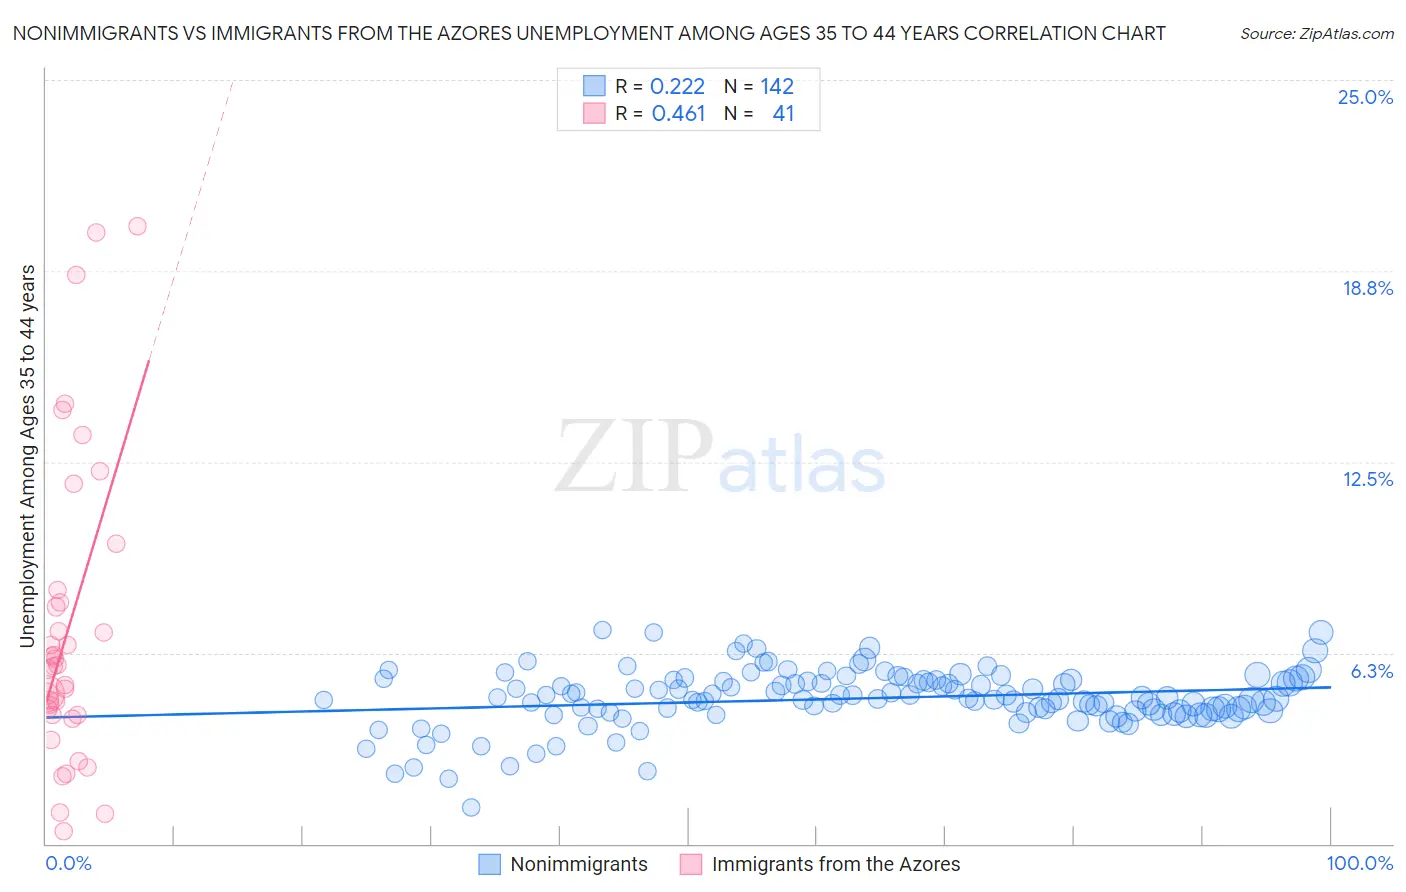
Nonimmigrants vs Immigrants from the Azores Unemployment Among Ages 35 to 44 years Correlation Chart

The statistical analysis conducted on geographies consisting of 530,556,110 people shows a weak positive correlation between the proportion of Nonimmigrants and unemployment rate among population between the ages 35 and 44 in the United States with a correlation coefficient (R) of 0.222 and weighted average of 4.9%. Similarly, the statistical analysis conducted on geographies consisting of 45,891,733 people shows a moderate positive correlation between the proportion of Immigrants from the Azores and unemployment rate among population between the ages 35 and 44 in the United States with a correlation coefficient (R) of 0.461 and weighted average of 5.8%, a difference of 18.4%.
Nonimmigrants vs Immigrants from the Azores Unemployment Among Ages 35 to 44 years

Unemployment Among Ages 35 to 44 years Correlation Summary

MeasurementNonimmigrantsImmigrants from the Azores
Minimum1.2%0.40%
Maximum7.0%20.2%
Range5.8%19.8%
Mean4.8%7.0%
Median4.8%5.8%
Interquartile 25% (IQ1)4.4%4.2%
Interquartile 75% (IQ3)5.3%8.1%
Interquartile Range (IQR)0.99%3.9%
Standard Deviation (Sample)0.94%4.9%
Standard Deviation (Population)0.94%4.9%

Similar Demographics by Unemployment Among Ages 35 to 44 years

Demographics Similar to Nonimmigrants by Unemployment Among Ages 35 to 44 years

In terms of unemployment among ages 35 to 44 years, the demographic groups most similar to Nonimmigrants are Fijian (4.9%, a difference of 0.16%), Osage (4.9%, a difference of 0.17%), Immigrants from Africa (4.9%, a difference of 0.26%), Immigrants (4.9%, a difference of 0.31%), and Immigrants from Cameroon (4.9%, a difference of 0.36%).
DemographicsRating | RankUnemployment Among Ages 35 to 44 years
Immigrants | Philippines
19.8
/100
|
#204
Poor
4.8%
Spaniards
18.7
/100
|
#205
Poor
4.8%
Soviet Union
18.4
/100
|
#206
Poor
4.8%
Immigrants | Western Asia
16.6
/100
|
#207
Poor
4.8%
French Canadians
16.5
/100
|
#208
Poor
4.8%
Immigrants | Uruguay
11.5
/100
|
#209
Poor
4.9%
Immigrants | Cameroon
11.4
/100
|
#210
Poor
4.9%
Immigrants | Nonimmigrants
9.4
/100
|
#211
Tragic
4.9%
Fijians
8.7
/100
|
#212
Tragic
4.9%
Osage
8.6
/100
|
#213
Tragic
4.9%
Immigrants | Africa
8.2
/100
|
#214
Tragic
4.9%
Immigrants | Immigrants
8.0
/100
|
#215
Tragic
4.9%
Americans
6.2
/100
|
#216
Tragic
4.9%
Moroccans
6.0
/100
|
#217
Tragic
4.9%
Chickasaw
5.7
/100
|
#218
Tragic
4.9%

Demographics Similar to Immigrants from the Azores by Unemployment Among Ages 35 to 44 years

In terms of unemployment among ages 35 to 44 years, the demographic groups most similar to Immigrants from the Azores are Immigrants from Belize (5.8%, a difference of 0.28%), Immigrants from Barbados (5.8%, a difference of 0.29%), Barbadian (5.7%, a difference of 0.82%), Guyanese (5.9%, a difference of 1.9%), and Belizean (5.7%, a difference of 2.0%).
DemographicsRating | RankUnemployment Among Ages 35 to 44 years
Africans
0.0
/100
|
#301
Tragic
5.6%
Nepalese
0.0
/100
|
#302
Tragic
5.6%
Yakama
0.0
/100
|
#303
Tragic
5.6%
West Indians
0.0
/100
|
#304
Tragic
5.7%
Belizeans
0.0
/100
|
#305
Tragic
5.7%
Barbadians
0.0
/100
|
#306
Tragic
5.7%
Immigrants | Belize
0.0
/100
|
#307
Tragic
5.8%
Immigrants | Azores
0.0
/100
|
#308
Tragic
5.8%
Immigrants | Barbados
0.0
/100
|
#309
Tragic
5.8%
Guyanese
0.0
/100
|
#310
Tragic
5.9%
Marshallese
0.0
/100
|
#311
Tragic
5.9%
Immigrants | Guyana
0.0
/100
|
#312
Tragic
6.0%
British West Indians
0.0
/100
|
#313
Tragic
6.0%
Immigrants | Dominica
0.0
/100
|
#314
Tragic
6.0%
Blacks/African Americans
0.0
/100
|
#315
Tragic
6.1%