Nigerian vs Immigrants from North Macedonia Unemployment Among Ages 55 to 59 years

COMPARE

Nigerian
Race
Ancestry
AfghanAfricanAlaska NativeAlaskan AthabascanAlbanianAleutAlsatianAmericanApacheArabArapahoArgentineanArmenianAssyrian/Chaldean/SyriacAustralianAustrianBahamianBangladeshiBarbadianBasqueBelgianBelizeanBermudanBhutaneseBlackfeetBolivianBrazilianBritishBritish West IndianBulgarianBurmeseCajunCambodianCanadianCape VerdeanCarpatho RusynCelticCentral AmericanCentral American IndianCherokeeCheyenneChickasawChileanChineseChippewaChoctawColombianColvilleComancheCosta RicanCreeCreekCroatianCrowCubanCypriotCzechCzechoslovakianDanishDelawareDominicanDutchDutch West IndianEastern EuropeanEcuadorianEgyptianEnglishEstonianEthiopianEuropeanFijianFilipinoFinnishFrenchFrench American IndianFrench CanadianGermanGerman RussianGhanaianGreekGuamanian/ChamorroGuatemalanGuyaneseHaitianHmongHonduranHopiHoumaHungarianIcelanderIndian (Asian)IndonesianInupiatIranianIraqiIrishIroquoisIsraeliItalianJamaicanJapaneseJordanianKenyanKiowaKoreanLaotianLatvianLebaneseLiberianLithuanianLumbeeLuxembourgerMacedonianMalaysianMalteseMarshalleseMenomineeMexicanMexican American IndianMongolianMoroccanNative HawaiianNavajoNepaleseNew ZealanderNicaraguanNigerianNorthern EuropeanNorwegianOkinawanOsageOttawaPaiutePakistaniPalestinianPanamanianParaguayanPennsylvania GermanPeruvianPimaPolishPortuguesePotawatomiPuebloPuerto RicanPuget Sound SalishRomanianRussianSalvadoranSamoanScandinavianScotch-IrishScottishSeminoleSenegaleseSerbianShoshoneSierra LeoneanSiouxSlavicSlovakSloveneSomaliSouth AfricanSouth AmericanSouth American IndianSoviet UnionSpaniardSpanishSpanish AmericanSpanish American IndianSri LankanSubsaharan AfricanSudaneseSwedishSwissSyrianTaiwaneseThaiTlingit-HaidaTohono O'OdhamTonganTrinidadian and TobagonianTsimshianTurkishU.S. Virgin IslanderUgandanUkrainianUruguayanUteVenezuelanVietnameseWelshWest IndianYakamaYaquiYugoslavianYumanYup'ikZimbabwean
Immigration
NonimmigrantsImmigrantsAfghanistanAfricaAlbaniaArgentinaArmeniaAsiaAustraliaAustriaBahamasBangladeshBarbadosBelarusBelgiumBelizeBoliviaBosnia and HerzegovinaBrazilBulgariaBurma/MyanmarCabo VerdeCambodiaCameroonCanadaCaribbeanCentral AmericaChileChinaColombiaCongoCosta RicaCroatiaCubaCzechoslovakiaDenmarkDominicaDominican RepublicEastern AfricaEastern AsiaEastern EuropeEcuadorEgyptEl SalvadorEnglandEritreaEthiopiaEuropeFijiFranceGermanyGhanaGreeceGrenadaGuatemalaGuyanaHaitiHondurasHong KongHungaryIndiaIndonesiaIranIraqIrelandIsraelItalyJamaicaJapanJordanKazakhstanKenyaKoreaKuwaitLaosLatin AmericaLatviaLebanonLiberiaLithuaniaMalaysiaMexicoMicronesiaMiddle AfricaMoldovaMoroccoNepalNetherlandsNicaraguaNigeriaNorth AmericaNorthern AfricaNorthern EuropeNorwayOceaniaPakistanPanamaPeruPhilippinesPolandPortugalRomaniaRussiaSaudi ArabiaScotlandSenegalSerbiaSierra LeoneSingaporeSomaliaSouth AfricaSouth AmericaSouth Central AsiaSouth Eastern AsiaSouthern EuropeSpainSri LankaSt. Vincent and the GrenadinesSudanSwedenSwitzerlandSyriaTaiwanThailandTrinidad and TobagoTurkeyUgandaUkraineUruguayUzbekistanVenezuelaVietnamWest IndiesWestern AfricaWestern AsiaWestern EuropeYemenZaireZimbabweAzores
Immigrants from North Macedonia
Race
Ancestry
AfghanAfricanAlaska NativeAlaskan AthabascanAlbanianAleutAlsatianAmericanApacheArabArapahoArgentineanArmenianAssyrian/Chaldean/SyriacAustralianAustrianBahamianBangladeshiBarbadianBasqueBelgianBelizeanBermudanBhutaneseBlackfeetBolivianBrazilianBritishBritish West IndianBulgarianBurmeseCajunCambodianCanadianCape VerdeanCarpatho RusynCelticCentral AmericanCentral American IndianCherokeeCheyenneChickasawChileanChineseChippewaChoctawColombianColvilleComancheCosta RicanCreeCreekCroatianCrowCubanCypriotCzechCzechoslovakianDanishDelawareDominicanDutchDutch West IndianEastern EuropeanEcuadorianEgyptianEnglishEstonianEthiopianEuropeanFijianFilipinoFinnishFrenchFrench American IndianFrench CanadianGermanGerman RussianGhanaianGreekGuamanian/ChamorroGuatemalanGuyaneseHaitianHmongHonduranHopiHoumaHungarianIcelanderIndian (Asian)IndonesianInupiatIranianIraqiIrishIroquoisIsraeliItalianJamaicanJapaneseJordanianKenyanKiowaKoreanLaotianLatvianLebaneseLiberianLithuanianLumbeeLuxembourgerMacedonianMalaysianMalteseMarshalleseMenomineeMexicanMexican American IndianMongolianMoroccanNative HawaiianNavajoNepaleseNew ZealanderNicaraguanNorthern EuropeanNorwegianOkinawanOsageOttawaPaiutePakistaniPalestinianPanamanianParaguayanPennsylvania GermanPeruvianPimaPolishPortuguesePotawatomiPuebloPuerto RicanPuget Sound SalishRomanianRussianSalvadoranSamoanScandinavianScotch-IrishScottishSeminoleSenegaleseSerbianShoshoneSierra LeoneanSiouxSlavicSlovakSloveneSomaliSouth AfricanSouth AmericanSouth American IndianSoviet UnionSpaniardSpanishSpanish AmericanSpanish American IndianSri LankanSubsaharan AfricanSudaneseSwedishSwissSyrianTaiwaneseThaiTlingit-HaidaTohono O'OdhamTonganTrinidadian and TobagonianTsimshianTurkishU.S. Virgin IslanderUgandanUkrainianUruguayanUteVenezuelanVietnameseWelshWest IndianYakamaYaquiYugoslavianYumanYup'ikZimbabwean
Immigration
NonimmigrantsImmigrantsAfghanistanAfricaAlbaniaArgentinaArmeniaAsiaAustraliaAustriaBahamasBangladeshBarbadosBelarusBelgiumBelizeBoliviaBosnia and HerzegovinaBrazilBulgariaBurma/MyanmarCabo VerdeCambodiaCameroonCanadaCaribbeanCentral AmericaChileChinaColombiaCongoCosta RicaCroatiaCubaCzechoslovakiaDenmarkDominicaDominican RepublicEastern AfricaEastern AsiaEastern EuropeEcuadorEgyptEl SalvadorEnglandEritreaEthiopiaEuropeFijiFranceGermanyGhanaGreeceGrenadaGuatemalaGuyanaHaitiHondurasHong KongHungaryIndiaIndonesiaIranIraqIrelandIsraelItalyJamaicaJapanJordanKazakhstanKenyaKoreaKuwaitLaosLatin AmericaLatviaLebanonLiberiaLithuaniaMalaysiaMexicoMicronesiaMiddle AfricaMoldovaMoroccoNepalNetherlandsNicaraguaNigeriaNorth AmericaNorth MacedoniaNorthern AfricaNorthern EuropeNorwayOceaniaPakistanPanamaPeruPhilippinesPolandPortugalRomaniaRussiaSaudi ArabiaScotlandSenegalSerbiaSierra LeoneSingaporeSomaliaSouth AfricaSouth AmericaSouth Central AsiaSouth Eastern AsiaSouthern EuropeSpainSri LankaSt. Vincent and the GrenadinesSudanSwedenSwitzerlandSyriaTaiwanThailandTrinidad and TobagoTurkeyUgandaUkraineUruguayUzbekistanVenezuelaVietnamWest IndiesWestern AfricaWestern AsiaWestern EuropeYemenZaireZimbabweAzores
Unemployment Among Ages 55 to 59 years
Income
Poverty
Unemployment
Labor Participation
Family Structure
Vehicle Availability
Education Level
Disability

Unemployment Among Ages 55 to 59 years Comparison

Nigerians

Immigrants from North Macedonia

Tragic
Good
4.9%
UNEMPLOYMENT AMONG AGES 55 TO 59 YEARS
7.5/ 100
METRIC RATING
221st/ 347
METRIC RANK
4.8%
UNEMPLOYMENT AMONG AGES 55 TO 59 YEARS
66.3/ 100
METRIC RATING
155th/ 347
METRIC RANK

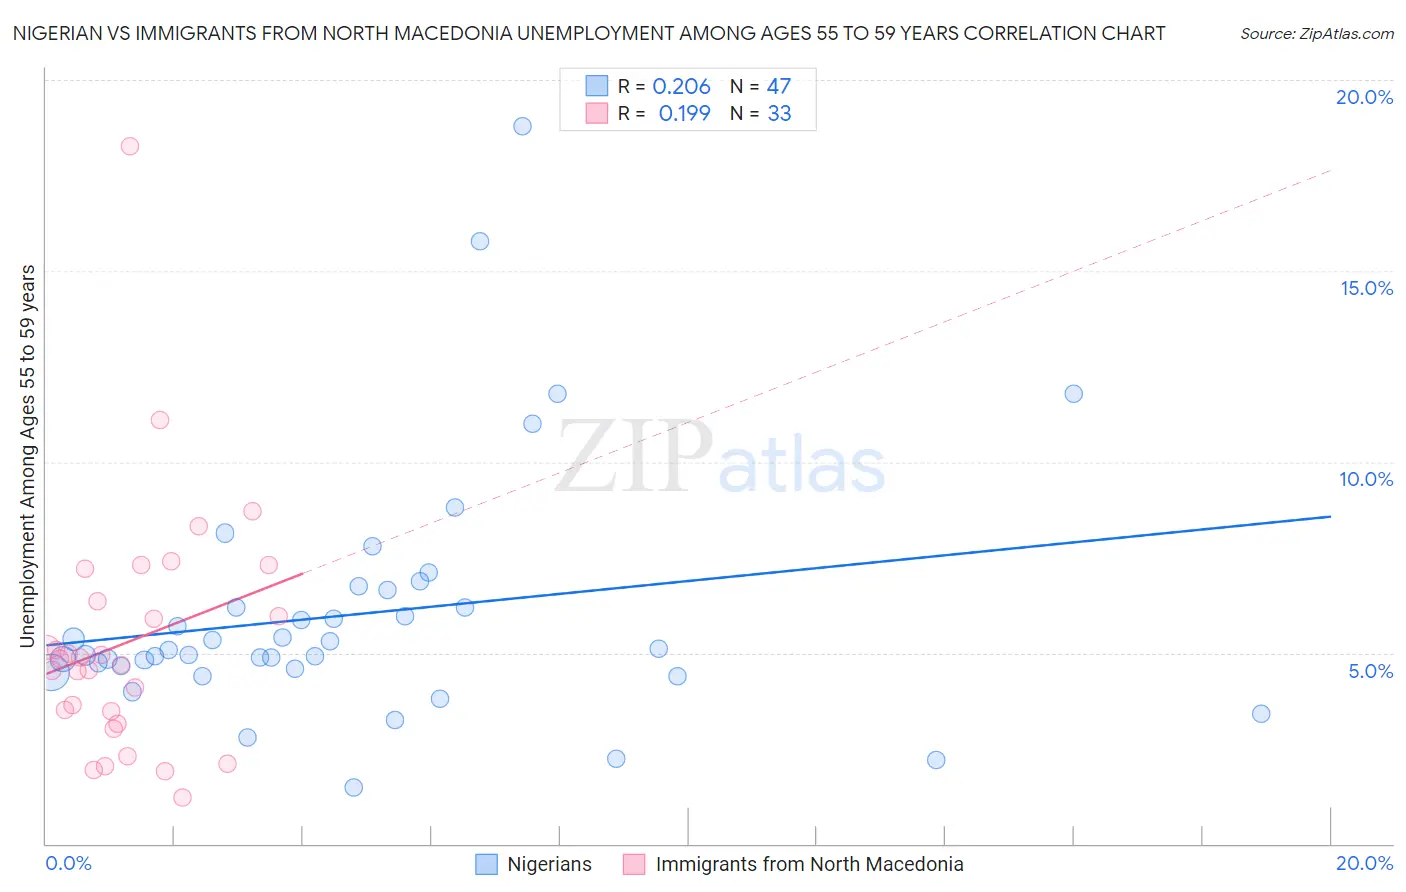
Nigerian vs Immigrants from North Macedonia Unemployment Among Ages 55 to 59 years Correlation Chart

The statistical analysis conducted on geographies consisting of 315,211,232 people shows a weak positive correlation between the proportion of Nigerians and unemployment rate among population between the ages 55 and 59 in the United States with a correlation coefficient (R) of 0.206 and weighted average of 4.9%. Similarly, the statistical analysis conducted on geographies consisting of 72,937,632 people shows a poor positive correlation between the proportion of Immigrants from North Macedonia and unemployment rate among population between the ages 55 and 59 in the United States with a correlation coefficient (R) of 0.199 and weighted average of 4.8%, a difference of 3.3%.
Nigerian vs Immigrants from North Macedonia Unemployment Among Ages 55 to 59 years

Unemployment Among Ages 55 to 59 years Correlation Summary

MeasurementNigerianImmigrants from North Macedonia
Minimum1.5%1.2%
Maximum18.8%18.3%
Range17.3%17.1%
Mean6.0%5.3%
Median5.1%4.8%
Interquartile 25% (IQ1)4.6%3.3%
Interquartile 75% (IQ3)6.6%6.8%
Interquartile Range (IQR)2.1%3.5%
Standard Deviation (Sample)3.2%3.2%
Standard Deviation (Population)3.2%3.2%

Similar Demographics by Unemployment Among Ages 55 to 59 years

Demographics Similar to Nigerians by Unemployment Among Ages 55 to 59 years

In terms of unemployment among ages 55 to 59 years, the demographic groups most similar to Nigerians are Indian (Asian) (4.9%, a difference of 0.010%), Immigrants from Austria (4.9%, a difference of 0.060%), Immigrants from Nigeria (4.9%, a difference of 0.060%), Spanish American (4.9%, a difference of 0.080%), and Immigrants from Brazil (4.9%, a difference of 0.080%).
DemographicsRating | RankUnemployment Among Ages 55 to 59 years
Immigrants | Denmark
10.3
/100
|
#214
Poor
4.9%
Syrians
8.6
/100
|
#215
Tragic
4.9%
Spanish Americans
8.1
/100
|
#216
Tragic
4.9%
Immigrants | Brazil
8.1
/100
|
#217
Tragic
4.9%
Immigrants | Austria
8.0
/100
|
#218
Tragic
4.9%
Immigrants | Nigeria
8.0
/100
|
#219
Tragic
4.9%
Indians (Asian)
7.6
/100
|
#220
Tragic
4.9%
Nigerians
7.5
/100
|
#221
Tragic
4.9%
Spanish
5.1
/100
|
#222
Tragic
5.0%
Immigrants | Ireland
4.8
/100
|
#223
Tragic
5.0%
Sub-Saharan Africans
4.4
/100
|
#224
Tragic
5.0%
Costa Ricans
4.4
/100
|
#225
Tragic
5.0%
Immigrants | China
4.2
/100
|
#226
Tragic
5.0%
Immigrants | Iran
3.7
/100
|
#227
Tragic
5.0%
Immigrants | Liberia
3.2
/100
|
#228
Tragic
5.0%

Demographics Similar to Immigrants from North Macedonia by Unemployment Among Ages 55 to 59 years

In terms of unemployment among ages 55 to 59 years, the demographic groups most similar to Immigrants from North Macedonia are Italian (4.8%, a difference of 0.0%), Carpatho Rusyn (4.8%, a difference of 0.010%), Immigrants from Panama (4.8%, a difference of 0.020%), Immigrants from Uruguay (4.8%, a difference of 0.040%), and Slovak (4.8%, a difference of 0.040%).
DemographicsRating | RankUnemployment Among Ages 55 to 59 years
Immigrants | Bahamas
71.8
/100
|
#148
Good
4.8%
Immigrants | Lithuania
70.8
/100
|
#149
Good
4.8%
Immigrants | Northern Africa
69.8
/100
|
#150
Good
4.8%
Bahamians
68.6
/100
|
#151
Good
4.8%
Laotians
68.2
/100
|
#152
Good
4.8%
Immigrants | Uruguay
67.2
/100
|
#153
Good
4.8%
Immigrants | Panama
66.8
/100
|
#154
Good
4.8%
Immigrants | North Macedonia
66.3
/100
|
#155
Good
4.8%
Italians
66.2
/100
|
#156
Good
4.8%
Carpatho Rusyns
66.0
/100
|
#157
Good
4.8%
Slovaks
65.3
/100
|
#158
Good
4.8%
Immigrants | Nicaragua
65.2
/100
|
#159
Good
4.8%
Chickasaw
65.1
/100
|
#160
Good
4.8%
Koreans
64.6
/100
|
#161
Good
4.8%
Immigrants | Africa
64.2
/100
|
#162
Good
4.8%