Nigerian vs Immigrants from France Female Unemployment
COMPARE
Nigerian
Immigrants from France
Female Unemployment
Female Unemployment Comparison
Nigerians
Immigrants from France
5.8%
FEMALE UNEMPLOYMENT
0.2/ 100
METRIC RATING
260th/ 347
METRIC RANK
5.1%
FEMALE UNEMPLOYMENT
82.7/ 100
METRIC RATING
140th/ 347
METRIC RANK
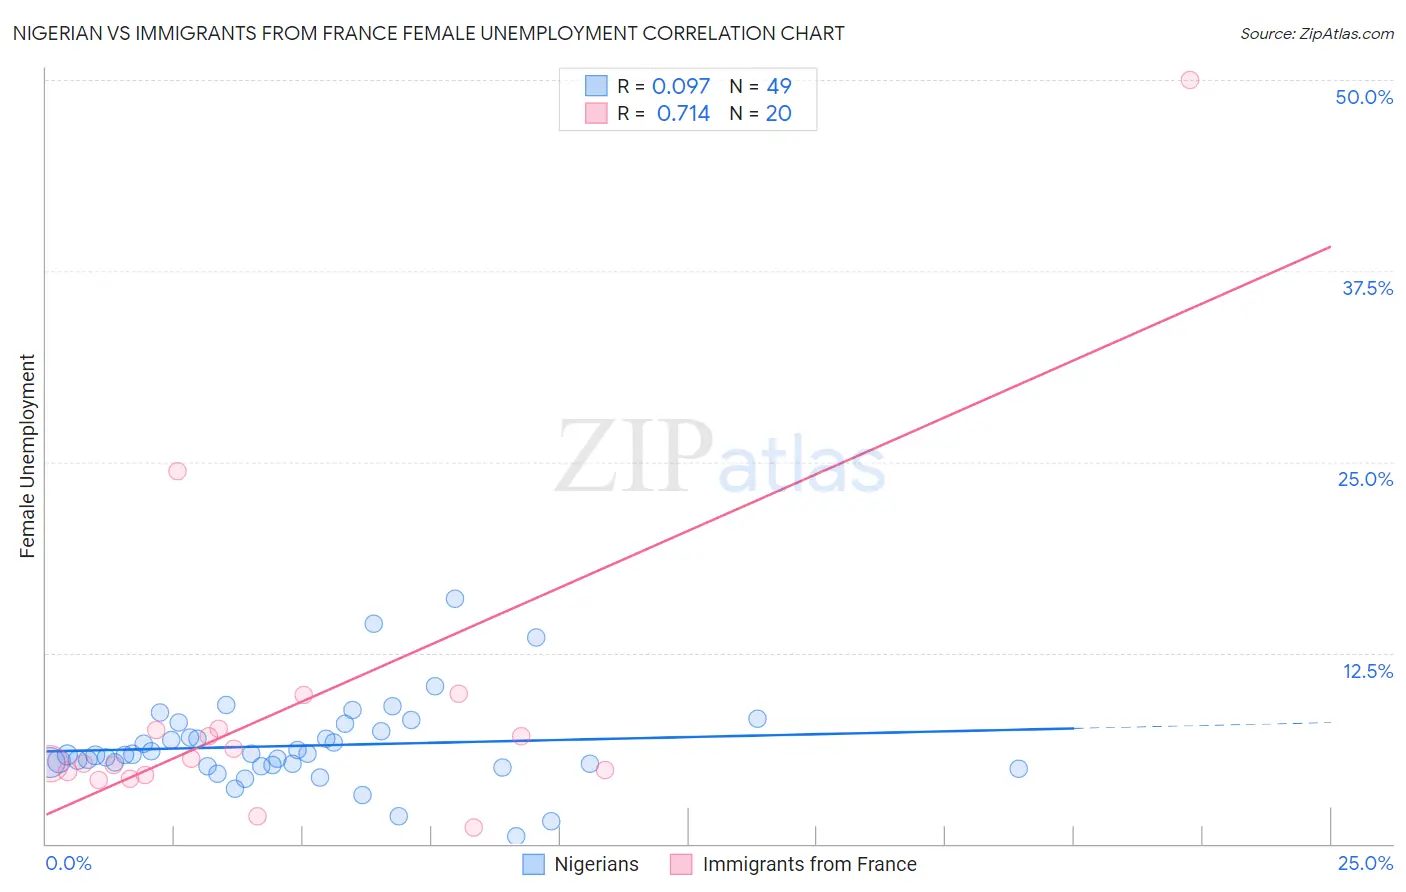
Nigerian vs Immigrants from France Female Unemployment Correlation Chart
The statistical analysis conducted on geographies consisting of 332,062,717 people shows a slight positive correlation between the proportion of Nigerians and unemploymnet rate among females in the United States with a correlation coefficient (R) of 0.097 and weighted average of 5.8%. Similarly, the statistical analysis conducted on geographies consisting of 287,167,055 people shows a strong positive correlation between the proportion of Immigrants from France and unemploymnet rate among females in the United States with a correlation coefficient (R) of 0.714 and weighted average of 5.1%, a difference of 12.2%.
Female Unemployment Correlation Summary
| Measurement | Nigerian | Immigrants from France |
| Minimum | 0.50% | 1.1% |
| Maximum | 16.0% | 50.0% |
| Range | 15.5% | 48.9% |
| Mean | 6.4% | 8.8% |
| Median | 5.8% | 5.4% |
| Interquartile 25% (IQ1) | 5.1% | 4.6% |
| Interquartile 75% (IQ3) | 7.6% | 7.5% |
| Interquartile Range (IQR) | 2.5% | 2.9% |
| Standard Deviation (Sample) | 2.9% | 10.8% |
| Standard Deviation (Population) | 2.8% | 10.5% |
Similar Demographics by Female Unemployment
Demographics Similar to Nigerians by Female Unemployment
In terms of female unemployment, the demographic groups most similar to Nigerians are Immigrants from Fiji (5.8%, a difference of 0.040%), Immigrants from Portugal (5.8%, a difference of 0.14%), Kiowa (5.8%, a difference of 0.26%), Immigrants from Nigeria (5.8%, a difference of 0.30%), and Dutch West Indian (5.7%, a difference of 0.95%).
| Demographics | Rating | Rank | Female Unemployment |
| Immigrants | Sierra Leone | 0.6 /100 | #253 | Tragic 5.7% |
| Immigrants | Immigrants | 0.6 /100 | #254 | Tragic 5.7% |
| Immigrants | Cameroon | 0.6 /100 | #255 | Tragic 5.7% |
| Sub-Saharan Africans | 0.4 /100 | #256 | Tragic 5.7% |
| Dutch West Indians | 0.3 /100 | #257 | Tragic 5.7% |
| Immigrants | Portugal | 0.2 /100 | #258 | Tragic 5.8% |
| Immigrants | Fiji | 0.2 /100 | #259 | Tragic 5.8% |
| Nigerians | 0.2 /100 | #260 | Tragic 5.8% |
| Kiowa | 0.1 /100 | #261 | Tragic 5.8% |
| Immigrants | Nigeria | 0.1 /100 | #262 | Tragic 5.8% |
| Immigrants | Azores | 0.1 /100 | #263 | Tragic 5.8% |
| Immigrants | Bahamas | 0.1 /100 | #264 | Tragic 5.8% |
| Blackfeet | 0.0 /100 | #265 | Tragic 5.9% |
| Cape Verdeans | 0.0 /100 | #266 | Tragic 5.9% |
| Nepalese | 0.0 /100 | #267 | Tragic 5.9% |
Demographics Similar to Immigrants from France by Female Unemployment
In terms of female unemployment, the demographic groups most similar to Immigrants from France are Immigrants from Eastern Asia (5.1%, a difference of 0.040%), Chickasaw (5.1%, a difference of 0.060%), Immigrants from Eastern Europe (5.1%, a difference of 0.12%), Pakistani (5.1%, a difference of 0.13%), and Indian (Asian) (5.1%, a difference of 0.17%).
| Demographics | Rating | Rank | Female Unemployment |
| Immigrants | Hong Kong | 84.8 /100 | #133 | Excellent 5.1% |
| Immigrants | Eritrea | 84.6 /100 | #134 | Excellent 5.1% |
| Immigrants | Latvia | 84.6 /100 | #135 | Excellent 5.1% |
| Indians (Asian) | 84.2 /100 | #136 | Excellent 5.1% |
| Pakistanis | 83.8 /100 | #137 | Excellent 5.1% |
| Chickasaw | 83.2 /100 | #138 | Excellent 5.1% |
| Immigrants | Eastern Asia | 83.0 /100 | #139 | Excellent 5.1% |
| Immigrants | France | 82.7 /100 | #140 | Excellent 5.1% |
| Immigrants | Eastern Europe | 81.5 /100 | #141 | Excellent 5.1% |
| Palestinians | 80.8 /100 | #142 | Excellent 5.1% |
| Immigrants | Kazakhstan | 80.7 /100 | #143 | Excellent 5.1% |
| Immigrants | Jordan | 80.4 /100 | #144 | Excellent 5.1% |
| Immigrants | Oceania | 79.5 /100 | #145 | Good 5.2% |
| Immigrants | Norway | 79.4 /100 | #146 | Good 5.2% |
| Argentineans | 79.2 /100 | #147 | Good 5.2% |