Nicaraguan vs Slovene Unemployment Among Ages 35 to 44 years

COMPARE

Nicaraguan
Race
Ancestry
AfghanAfricanAlaska NativeAlaskan AthabascanAlbanianAleutAlsatianAmericanApacheArabArapahoArgentineanArmenianAssyrian/Chaldean/SyriacAustralianAustrianBahamianBangladeshiBarbadianBasqueBelgianBelizeanBermudanBhutaneseBlackfeetBolivianBrazilianBritishBritish West IndianBulgarianBurmeseCajunCambodianCanadianCape VerdeanCarpatho RusynCelticCentral AmericanCentral American IndianCherokeeCheyenneChickasawChileanChineseChippewaChoctawColombianColvilleComancheCosta RicanCreeCreekCroatianCrowCubanCypriotCzechCzechoslovakianDanishDelawareDominicanDutchDutch West IndianEastern EuropeanEcuadorianEgyptianEnglishEstonianEthiopianEuropeanFijianFilipinoFinnishFrenchFrench American IndianFrench CanadianGermanGerman RussianGhanaianGreekGuamanian/ChamorroGuatemalanGuyaneseHaitianHmongHonduranHopiHoumaHungarianIcelanderIndian (Asian)IndonesianInupiatIranianIraqiIrishIroquoisIsraeliItalianJamaicanJapaneseJordanianKenyanKiowaKoreanLaotianLatvianLebaneseLiberianLithuanianLumbeeLuxembourgerMacedonianMalaysianMalteseMarshalleseMenomineeMexicanMexican American IndianMongolianMoroccanNative HawaiianNavajoNepaleseNew ZealanderNicaraguanNigerianNorthern EuropeanNorwegianOkinawanOsageOttawaPaiutePakistaniPalestinianPanamanianParaguayanPennsylvania GermanPeruvianPimaPolishPortuguesePotawatomiPuebloPuerto RicanPuget Sound SalishRomanianRussianSalvadoranSamoanScandinavianScotch-IrishScottishSeminoleSenegaleseSerbianShoshoneSierra LeoneanSiouxSlavicSlovakSomaliSouth AfricanSouth AmericanSouth American IndianSoviet UnionSpaniardSpanishSpanish AmericanSpanish American IndianSri LankanSubsaharan AfricanSudaneseSwedishSwissSyrianTaiwaneseThaiTlingit-HaidaTohono O'OdhamTonganTrinidadian and TobagonianTsimshianTurkishU.S. Virgin IslanderUgandanUkrainianUruguayanUteVenezuelanVietnameseWelshWest IndianYakamaYaquiYugoslavianYumanYup'ikZimbabwean
Immigration
NonimmigrantsImmigrantsAfghanistanAfricaAlbaniaArgentinaArmeniaAsiaAustraliaAustriaBahamasBangladeshBarbadosBelarusBelgiumBelizeBoliviaBosnia and HerzegovinaBrazilBulgariaBurma/MyanmarCabo VerdeCambodiaCameroonCanadaCaribbeanCentral AmericaChileChinaColombiaCongoCosta RicaCroatiaCubaCzechoslovakiaDenmarkDominicaDominican RepublicEastern AfricaEastern AsiaEastern EuropeEcuadorEgyptEl SalvadorEnglandEritreaEthiopiaEuropeFijiFranceGermanyGhanaGreeceGrenadaGuatemalaGuyanaHaitiHondurasHong KongHungaryIndiaIndonesiaIranIraqIrelandIsraelItalyJamaicaJapanJordanKazakhstanKenyaKoreaKuwaitLaosLatin AmericaLatviaLebanonLiberiaLithuaniaMalaysiaMexicoMicronesiaMiddle AfricaMoldovaMoroccoNepalNetherlandsNicaraguaNigeriaNorth AmericaNorth MacedoniaNorthern AfricaNorthern EuropeNorwayOceaniaPakistanPanamaPeruPhilippinesPolandPortugalRomaniaRussiaSaudi ArabiaScotlandSenegalSerbiaSierra LeoneSingaporeSomaliaSouth AfricaSouth AmericaSouth Central AsiaSouth Eastern AsiaSouthern EuropeSpainSri LankaSt. Vincent and the GrenadinesSudanSwedenSwitzerlandSyriaTaiwanThailandTrinidad and TobagoTurkeyUgandaUkraineUruguayUzbekistanVenezuelaVietnamWest IndiesWestern AfricaWestern AsiaWestern EuropeYemenZaireZimbabweAzores
Slovene
Race
Ancestry
AfghanAfricanAlaska NativeAlaskan AthabascanAlbanianAleutAlsatianAmericanApacheArabArapahoArgentineanArmenianAssyrian/Chaldean/SyriacAustralianAustrianBahamianBangladeshiBarbadianBasqueBelgianBelizeanBermudanBhutaneseBlackfeetBolivianBrazilianBritishBritish West IndianBulgarianBurmeseCajunCambodianCanadianCape VerdeanCarpatho RusynCelticCentral AmericanCentral American IndianCherokeeCheyenneChickasawChileanChineseChippewaChoctawColombianColvilleComancheCosta RicanCreeCreekCroatianCrowCubanCypriotCzechCzechoslovakianDanishDelawareDominicanDutchDutch West IndianEastern EuropeanEcuadorianEgyptianEnglishEstonianEthiopianEuropeanFijianFilipinoFinnishFrenchFrench American IndianFrench CanadianGermanGerman RussianGhanaianGreekGuamanian/ChamorroGuatemalanGuyaneseHaitianHmongHonduranHopiHoumaHungarianIcelanderIndian (Asian)IndonesianInupiatIranianIraqiIrishIroquoisIsraeliItalianJamaicanJapaneseJordanianKenyanKiowaKoreanLaotianLatvianLebaneseLiberianLithuanianLumbeeLuxembourgerMacedonianMalaysianMalteseMarshalleseMenomineeMexicanMexican American IndianMongolianMoroccanNative HawaiianNavajoNepaleseNew ZealanderNigerianNorthern EuropeanNorwegianOkinawanOsageOttawaPaiutePakistaniPalestinianPanamanianParaguayanPennsylvania GermanPeruvianPimaPolishPortuguesePotawatomiPuebloPuerto RicanPuget Sound SalishRomanianRussianSalvadoranSamoanScandinavianScotch-IrishScottishSeminoleSenegaleseSerbianShoshoneSierra LeoneanSiouxSlavicSlovakSloveneSomaliSouth AfricanSouth AmericanSouth American IndianSoviet UnionSpaniardSpanishSpanish AmericanSpanish American IndianSri LankanSubsaharan AfricanSudaneseSwedishSwissSyrianTaiwaneseThaiTlingit-HaidaTohono O'OdhamTonganTrinidadian and TobagonianTsimshianTurkishU.S. Virgin IslanderUgandanUkrainianUruguayanUteVenezuelanVietnameseWelshWest IndianYakamaYaquiYugoslavianYumanYup'ikZimbabwean
Immigration
NonimmigrantsImmigrantsAfghanistanAfricaAlbaniaArgentinaArmeniaAsiaAustraliaAustriaBahamasBangladeshBarbadosBelarusBelgiumBelizeBoliviaBosnia and HerzegovinaBrazilBulgariaBurma/MyanmarCabo VerdeCambodiaCameroonCanadaCaribbeanCentral AmericaChileChinaColombiaCongoCosta RicaCroatiaCubaCzechoslovakiaDenmarkDominicaDominican RepublicEastern AfricaEastern AsiaEastern EuropeEcuadorEgyptEl SalvadorEnglandEritreaEthiopiaEuropeFijiFranceGermanyGhanaGreeceGrenadaGuatemalaGuyanaHaitiHondurasHong KongHungaryIndiaIndonesiaIranIraqIrelandIsraelItalyJamaicaJapanJordanKazakhstanKenyaKoreaKuwaitLaosLatin AmericaLatviaLebanonLiberiaLithuaniaMalaysiaMexicoMicronesiaMiddle AfricaMoldovaMoroccoNepalNetherlandsNicaraguaNigeriaNorth AmericaNorth MacedoniaNorthern AfricaNorthern EuropeNorwayOceaniaPakistanPanamaPeruPhilippinesPolandPortugalRomaniaRussiaSaudi ArabiaScotlandSenegalSerbiaSierra LeoneSingaporeSomaliaSouth AfricaSouth AmericaSouth Central AsiaSouth Eastern AsiaSouthern EuropeSpainSri LankaSt. Vincent and the GrenadinesSudanSwedenSwitzerlandSyriaTaiwanThailandTrinidad and TobagoTurkeyUgandaUkraineUruguayUzbekistanVenezuelaVietnamWest IndiesWestern AfricaWestern AsiaWestern EuropeYemenZaireZimbabweAzores
Unemployment Among Ages 35 to 44 years
Income
Poverty
Unemployment
Labor Participation
Family Structure
Vehicle Availability
Education Level
Disability

Unemployment Among Ages 35 to 44 years Comparison

Nicaraguans

Slovenes

Excellent
Exceptional
4.5%
UNEMPLOYMENT AMONG AGES 35 TO 44 YEARS
87.6/ 100
METRIC RATING
119th/ 347
METRIC RANK
4.4%
UNEMPLOYMENT AMONG AGES 35 TO 44 YEARS
96.7/ 100
METRIC RATING
69th/ 347
METRIC RANK

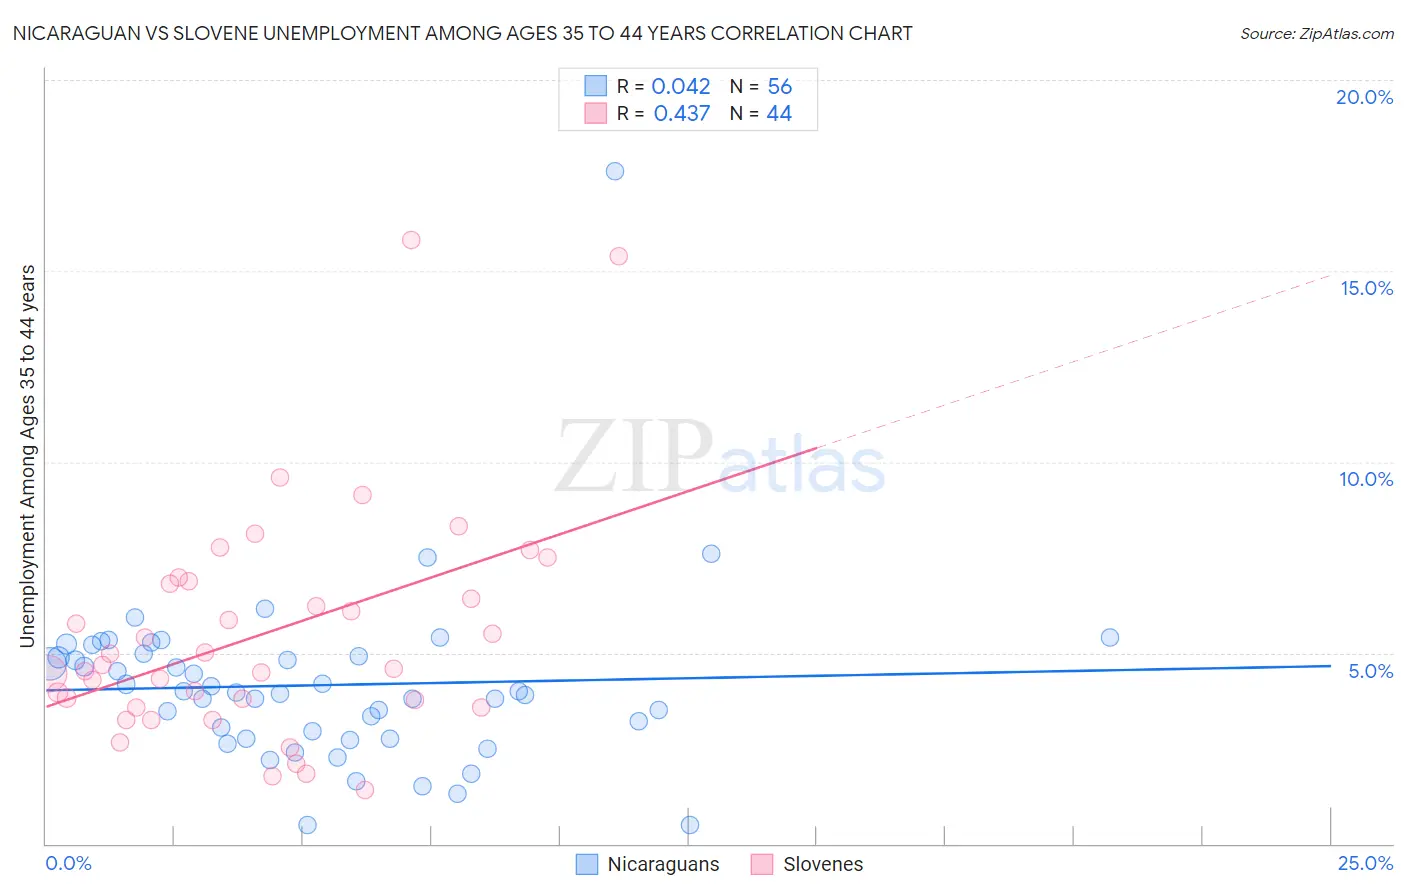
Nicaraguan vs Slovene Unemployment Among Ages 35 to 44 years Correlation Chart

The statistical analysis conducted on geographies consisting of 282,755,900 people shows no correlation between the proportion of Nicaraguans and unemployment rate among population between the ages 35 and 44 in the United States with a correlation coefficient (R) of 0.042 and weighted average of 4.5%. Similarly, the statistical analysis conducted on geographies consisting of 256,107,792 people shows a moderate positive correlation between the proportion of Slovenes and unemployment rate among population between the ages 35 and 44 in the United States with a correlation coefficient (R) of 0.437 and weighted average of 4.4%, a difference of 2.7%.
Nicaraguan vs Slovene Unemployment Among Ages 35 to 44 years

Unemployment Among Ages 35 to 44 years Correlation Summary

MeasurementNicaraguanSlovene
Minimum0.50%1.4%
Maximum17.6%15.8%
Range17.1%14.4%
Mean4.2%5.5%
Median4.0%4.6%
Interquartile 25% (IQ1)2.8%3.7%
Interquartile 75% (IQ3)4.9%6.8%
Interquartile Range (IQR)2.1%3.2%
Standard Deviation (Sample)2.4%3.0%
Standard Deviation (Population)2.3%3.0%

Similar Demographics by Unemployment Among Ages 35 to 44 years

Demographics Similar to Nicaraguans by Unemployment Among Ages 35 to 44 years

In terms of unemployment among ages 35 to 44 years, the demographic groups most similar to Nicaraguans are Irish (4.5%, a difference of 0.050%), Immigrants from Greece (4.5%, a difference of 0.060%), Ethiopian (4.5%, a difference of 0.080%), Immigrants from Israel (4.5%, a difference of 0.090%), and Maltese (4.5%, a difference of 0.10%).
DemographicsRating | RankUnemployment Among Ages 35 to 44 years
Immigrants | Czechoslovakia
89.2
/100
|
#112
Excellent
4.5%
Immigrants | Italy
88.4
/100
|
#113
Excellent
4.5%
Macedonians
88.3
/100
|
#114
Excellent
4.5%
Maltese
88.1
/100
|
#115
Excellent
4.5%
Immigrants | Israel
88.1
/100
|
#116
Excellent
4.5%
Immigrants | Greece
87.9
/100
|
#117
Excellent
4.5%
Irish
87.9
/100
|
#118
Excellent
4.5%
Nicaraguans
87.6
/100
|
#119
Excellent
4.5%
Ethiopians
87.1
/100
|
#120
Excellent
4.5%
Immigrants | South Africa
86.8
/100
|
#121
Excellent
4.5%
Sri Lankans
86.8
/100
|
#122
Excellent
4.5%
Basques
86.3
/100
|
#123
Excellent
4.5%
Immigrants | Spain
86.1
/100
|
#124
Excellent
4.5%
Immigrants | Northern Africa
86.1
/100
|
#125
Excellent
4.5%
Immigrants | Austria
84.7
/100
|
#126
Excellent
4.5%

Demographics Similar to Slovenes by Unemployment Among Ages 35 to 44 years

In terms of unemployment among ages 35 to 44 years, the demographic groups most similar to Slovenes are Immigrants from China (4.4%, a difference of 0.0%), Immigrants from Lithuania (4.4%, a difference of 0.0%), Immigrants from Ireland (4.4%, a difference of 0.060%), Argentinean (4.4%, a difference of 0.070%), and Icelander (4.4%, a difference of 0.080%).
DemographicsRating | RankUnemployment Among Ages 35 to 44 years
Immigrants | Bulgaria
97.1
/100
|
#62
Exceptional
4.4%
Austrians
97.1
/100
|
#63
Exceptional
4.4%
Immigrants | Serbia
97.0
/100
|
#64
Exceptional
4.4%
Cambodians
97.0
/100
|
#65
Exceptional
4.4%
Icelanders
96.8
/100
|
#66
Exceptional
4.4%
Argentineans
96.8
/100
|
#67
Exceptional
4.4%
Immigrants | Ireland
96.8
/100
|
#68
Exceptional
4.4%
Slovenes
96.7
/100
|
#69
Exceptional
4.4%
Immigrants | China
96.7
/100
|
#70
Exceptional
4.4%
Immigrants | Lithuania
96.7
/100
|
#71
Exceptional
4.4%
Northern Europeans
96.5
/100
|
#72
Exceptional
4.4%
Lithuanians
96.5
/100
|
#73
Exceptional
4.4%
Poles
96.4
/100
|
#74
Exceptional
4.4%
Immigrants | Romania
96.3
/100
|
#75
Exceptional
4.4%
Immigrants | Jordan
96.3
/100
|
#76
Exceptional
4.4%