Nicaraguan vs Immigrants from Cuba Unemployment Among Women with Children Under 18 years
COMPARE
Nicaraguan
Immigrants from Cuba
Unemployment Among Women with Children Under 18 years
Unemployment Among Women with Children Under 18 years Comparison
Nicaraguans
Immigrants from Cuba
5.6%
UNEMPLOYMENT AMONG WOMEN WITH CHILDREN UNDER 18 YEARS
12.3/ 100
METRIC RATING
206th/ 347
METRIC RANK
5.2%
UNEMPLOYMENT AMONG WOMEN WITH CHILDREN UNDER 18 YEARS
90.9/ 100
METRIC RATING
102nd/ 347
METRIC RANK
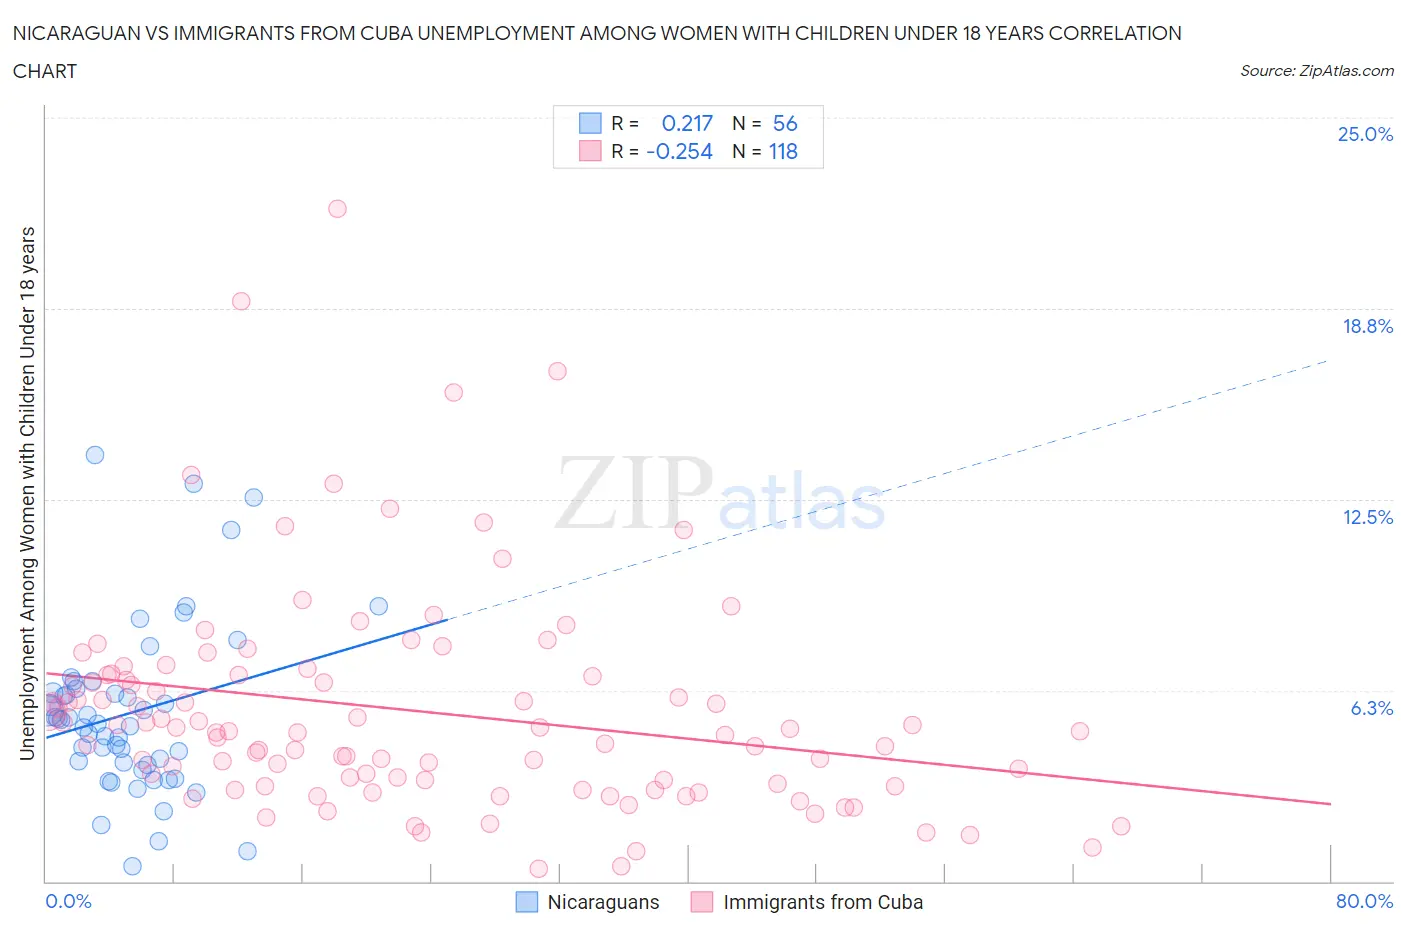
Nicaraguan vs Immigrants from Cuba Unemployment Among Women with Children Under 18 years Correlation Chart
The statistical analysis conducted on geographies consisting of 280,093,302 people shows a weak positive correlation between the proportion of Nicaraguans and unemployment rate among women with children under the age of 18 in the United States with a correlation coefficient (R) of 0.217 and weighted average of 5.6%. Similarly, the statistical analysis conducted on geographies consisting of 316,364,577 people shows a weak negative correlation between the proportion of Immigrants from Cuba and unemployment rate among women with children under the age of 18 in the United States with a correlation coefficient (R) of -0.254 and weighted average of 5.2%, a difference of 7.9%.
Unemployment Among Women with Children Under 18 years Correlation Summary
| Measurement | Nicaraguan | Immigrants from Cuba |
| Minimum | 0.50% | 0.40% |
| Maximum | 14.0% | 22.0% |
| Range | 13.5% | 21.6% |
| Mean | 5.5% | 5.6% |
| Median | 5.2% | 4.9% |
| Interquartile 25% (IQ1) | 3.9% | 3.2% |
| Interquartile 75% (IQ3) | 6.2% | 6.7% |
| Interquartile Range (IQR) | 2.4% | 3.5% |
| Standard Deviation (Sample) | 2.8% | 3.6% |
| Standard Deviation (Population) | 2.7% | 3.6% |
Similar Demographics by Unemployment Among Women with Children Under 18 years
Demographics Similar to Nicaraguans by Unemployment Among Women with Children Under 18 years
In terms of unemployment among women with children under 18 years, the demographic groups most similar to Nicaraguans are Peruvian (5.6%, a difference of 0.040%), Immigrants from Costa Rica (5.6%, a difference of 0.12%), Immigrants from Western Asia (5.6%, a difference of 0.18%), Nonimmigrants (5.7%, a difference of 0.29%), and Panamanian (5.7%, a difference of 0.39%).
| Demographics | Rating | Rank | Unemployment Among Women with Children Under 18 years |
| Marshallese | 20.2 /100 | #199 | Fair 5.6% |
| Menominee | 18.6 /100 | #200 | Poor 5.6% |
| Immigrants | Morocco | 17.9 /100 | #201 | Poor 5.6% |
| Immigrants | Micronesia | 17.1 /100 | #202 | Poor 5.6% |
| Portuguese | 15.9 /100 | #203 | Poor 5.6% |
| Israelis | 15.6 /100 | #204 | Poor 5.6% |
| Tsimshian | 15.2 /100 | #205 | Poor 5.6% |
| Nicaraguans | 12.3 /100 | #206 | Poor 5.6% |
| Peruvians | 12.1 /100 | #207 | Poor 5.6% |
| Immigrants | Costa Rica | 11.6 /100 | #208 | Poor 5.6% |
| Immigrants | Western Asia | 11.3 /100 | #209 | Poor 5.6% |
| Immigrants | Nonimmigrants | 10.6 /100 | #210 | Poor 5.7% |
| Panamanians | 10.1 /100 | #211 | Poor 5.7% |
| South Americans | 10.0 /100 | #212 | Poor 5.7% |
| Americans | 8.9 /100 | #213 | Tragic 5.7% |
Demographics Similar to Immigrants from Cuba by Unemployment Among Women with Children Under 18 years
In terms of unemployment among women with children under 18 years, the demographic groups most similar to Immigrants from Cuba are Immigrants from Netherlands (5.2%, a difference of 0.010%), Immigrants from Greece (5.2%, a difference of 0.10%), Sri Lankan (5.2%, a difference of 0.15%), Immigrants from Switzerland (5.2%, a difference of 0.18%), and Cuban (5.2%, a difference of 0.19%).
| Demographics | Rating | Rank | Unemployment Among Women with Children Under 18 years |
| Immigrants | North America | 92.3 /100 | #95 | Exceptional 5.2% |
| Immigrants | Albania | 92.2 /100 | #96 | Exceptional 5.2% |
| Palestinians | 92.2 /100 | #97 | Exceptional 5.2% |
| Immigrants | Vietnam | 92.0 /100 | #98 | Exceptional 5.2% |
| Cubans | 91.8 /100 | #99 | Exceptional 5.2% |
| Immigrants | Greece | 91.4 /100 | #100 | Exceptional 5.2% |
| Immigrants | Netherlands | 91.0 /100 | #101 | Exceptional 5.2% |
| Immigrants | Cuba | 90.9 /100 | #102 | Exceptional 5.2% |
| Sri Lankans | 90.3 /100 | #103 | Exceptional 5.2% |
| Immigrants | Switzerland | 90.1 /100 | #104 | Exceptional 5.2% |
| Immigrants | France | 90.0 /100 | #105 | Excellent 5.2% |
| Pakistanis | 89.9 /100 | #106 | Excellent 5.2% |
| Slavs | 89.8 /100 | #107 | Excellent 5.2% |
| Iranians | 89.7 /100 | #108 | Excellent 5.2% |
| Immigrants | Russia | 89.0 /100 | #109 | Excellent 5.2% |